
Unity & iOS Memory Architecture


iOS Memory Architecture
Physical Memory (RAM)
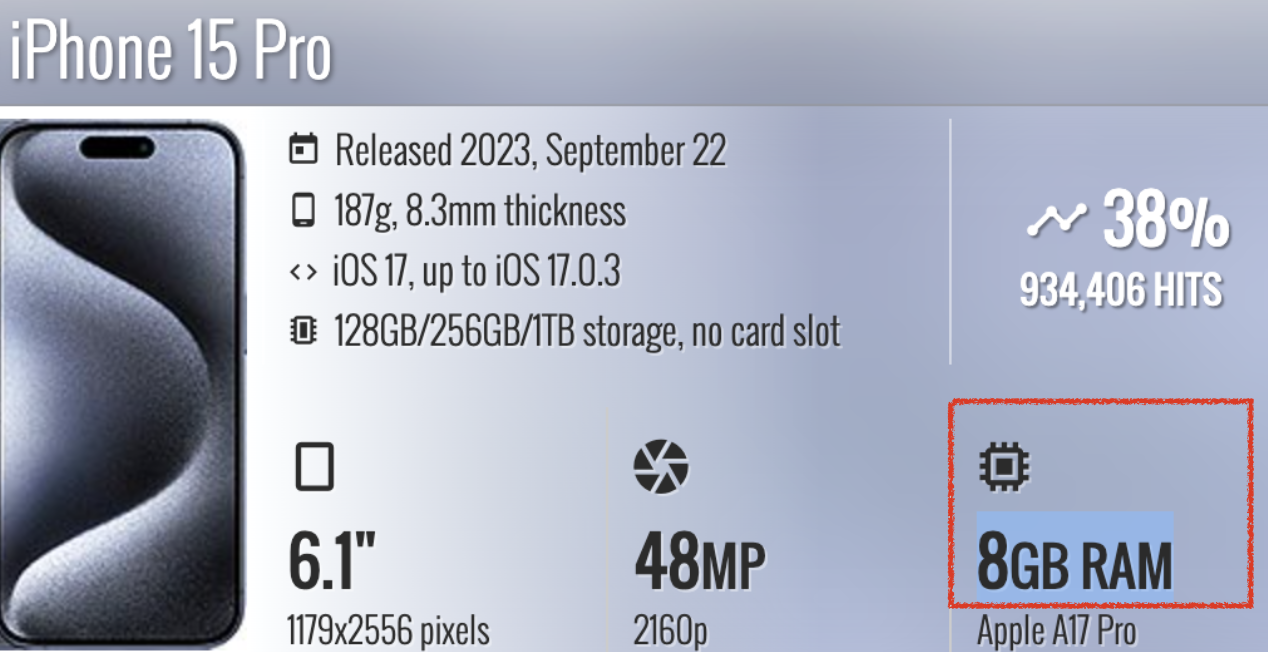
- You cannot physically add more memory at runtime.
- Do not allocate beyond this limit.
- Physical memory usage != app VM allocation
The app cannot directly know or use physical memory.
App memory is allocated in VM (Virtual Memory).
Virtual Memory (VM - Virtual Memory)
- Apps do not use physical memory directly.
- Allocation happens in VM.
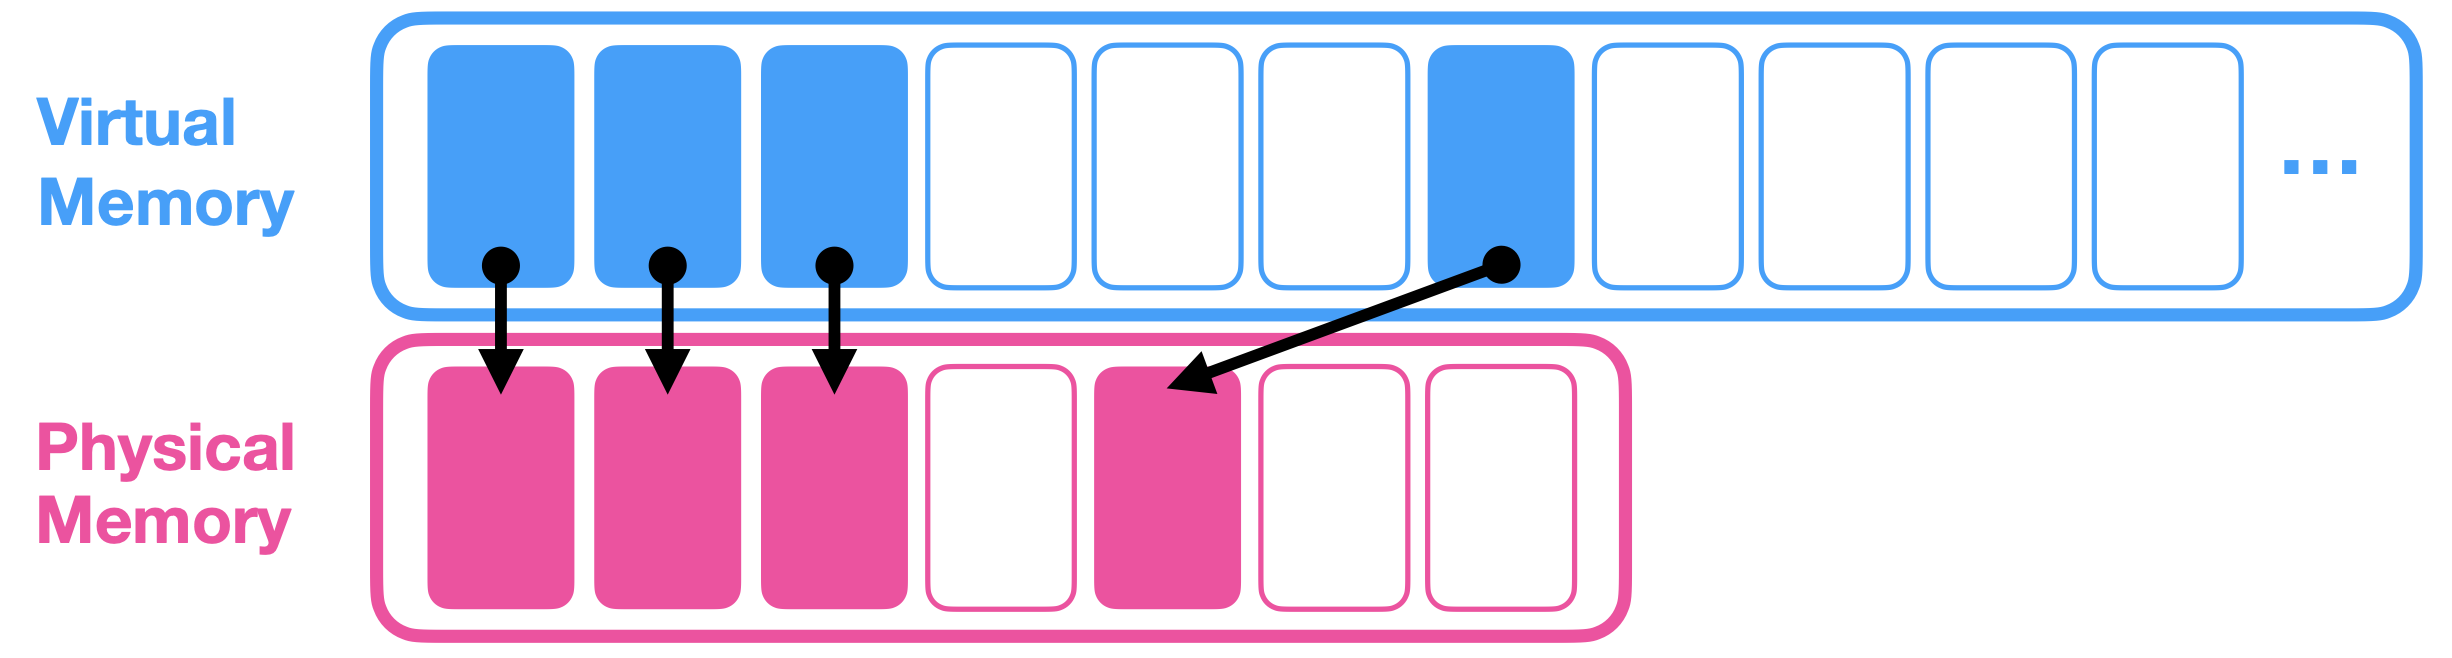
- VM is split into pages (4KB or 16KB).
- Pages are mapped to physical memory.
- Pages are usually either Clean or Dirty.
- The engine reserves new pages, then asks the OS to commit them into PM.
- Unity calls committed allocation
Total **Committed** Memory. - If reserved pages that requested commit are not actually used, they may not be committed to PM.
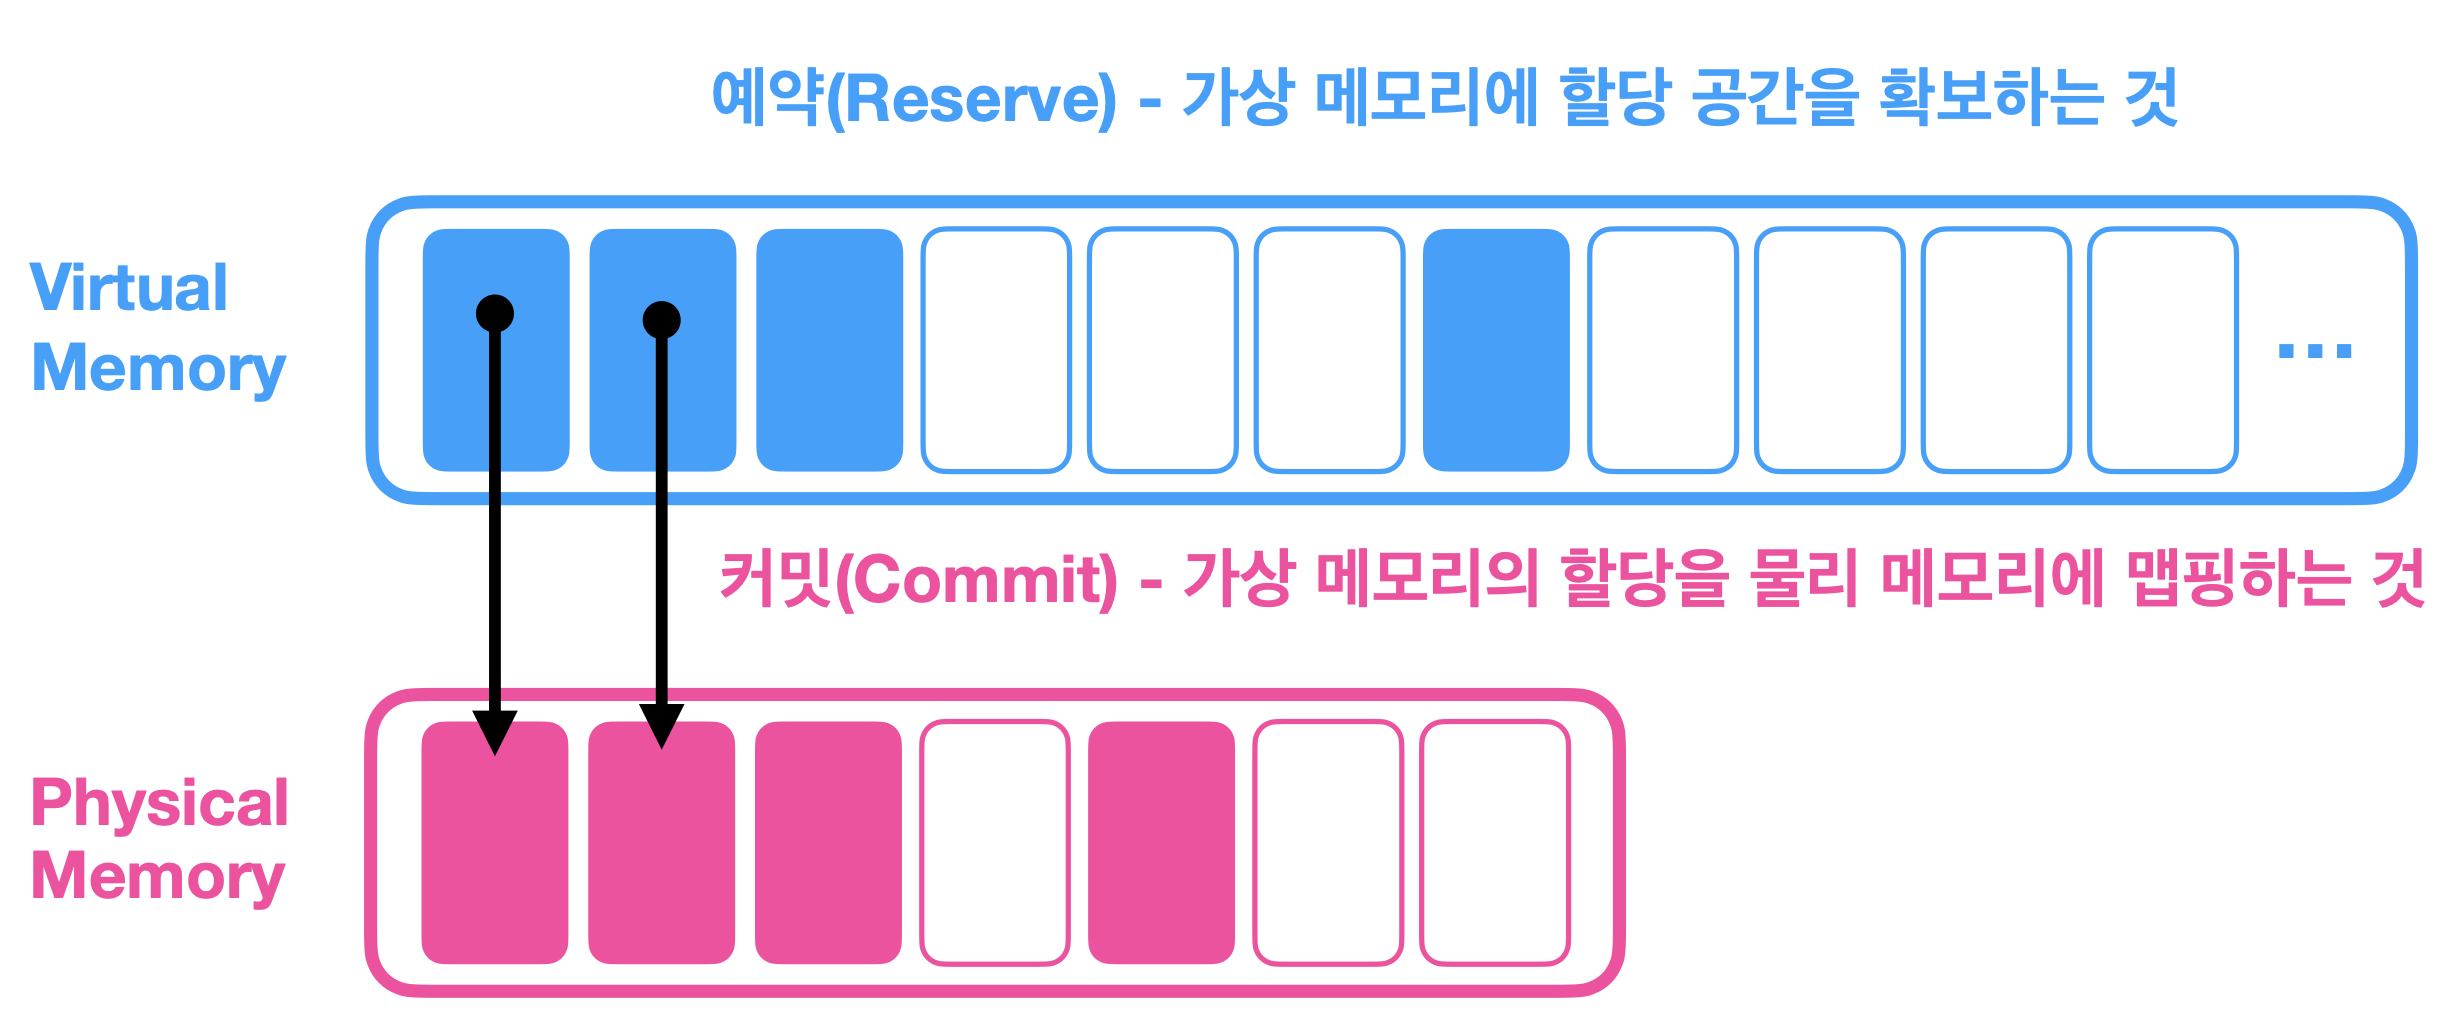
- Physical memory usage != VM usage
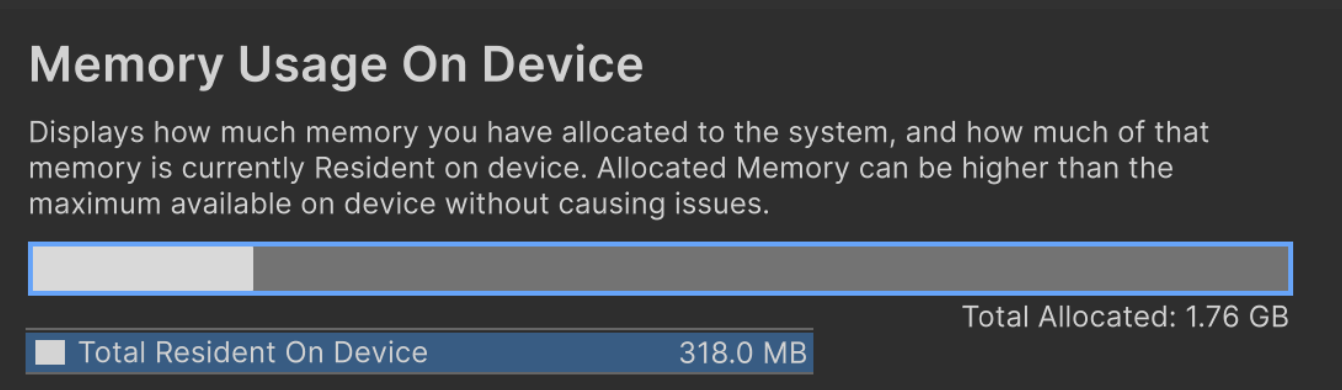
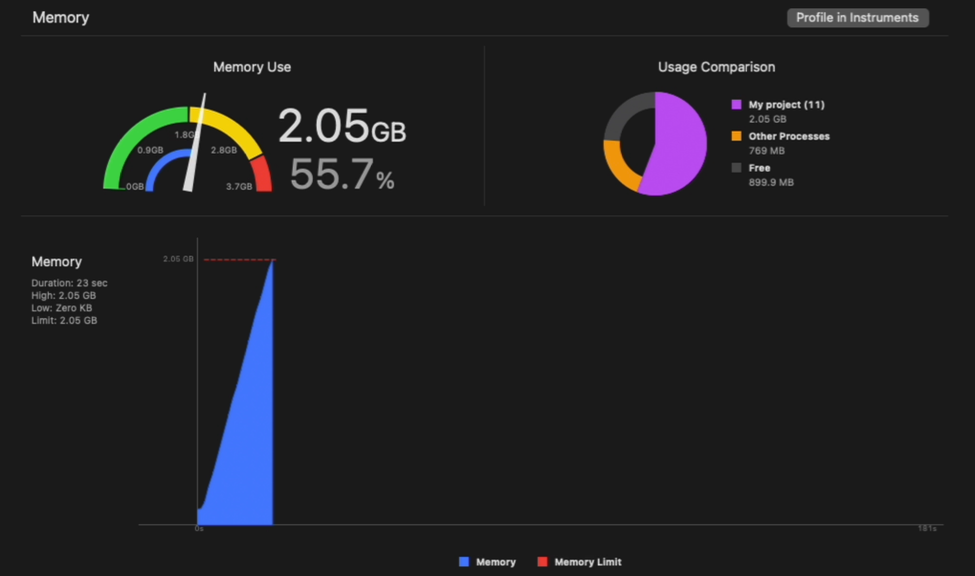
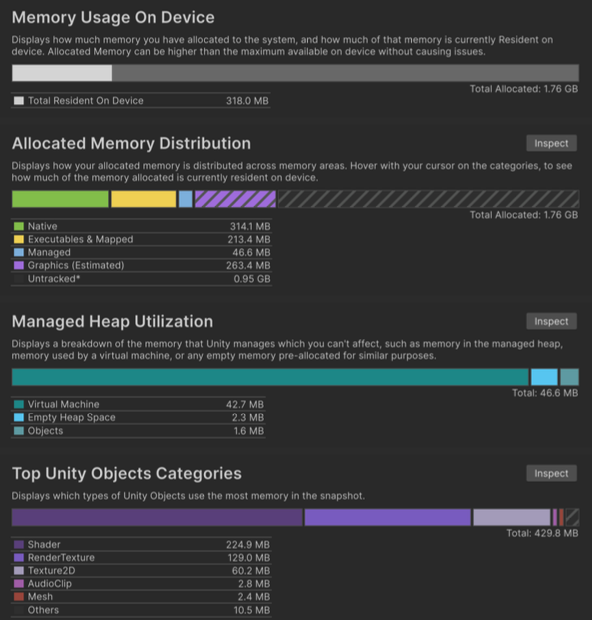
- Resident memory: 318.0 MB, Total allocated: 1.76 GB
Example: 1.78 GB allocated, but actual usage is around 380 MB.
Benefits of VM
- Optimization happens between PM and VM.
- Simplicity: the app does not need to deal with physical-memory-level optimization directly.
- VM usage can be high while physical memory usage remains low.
- The real key is: how much physical memory is actually used?
Memory Footprint
- Memory footprint means the app’s actual occupied size.
Sum of allocation regions with high resident memory ratio.
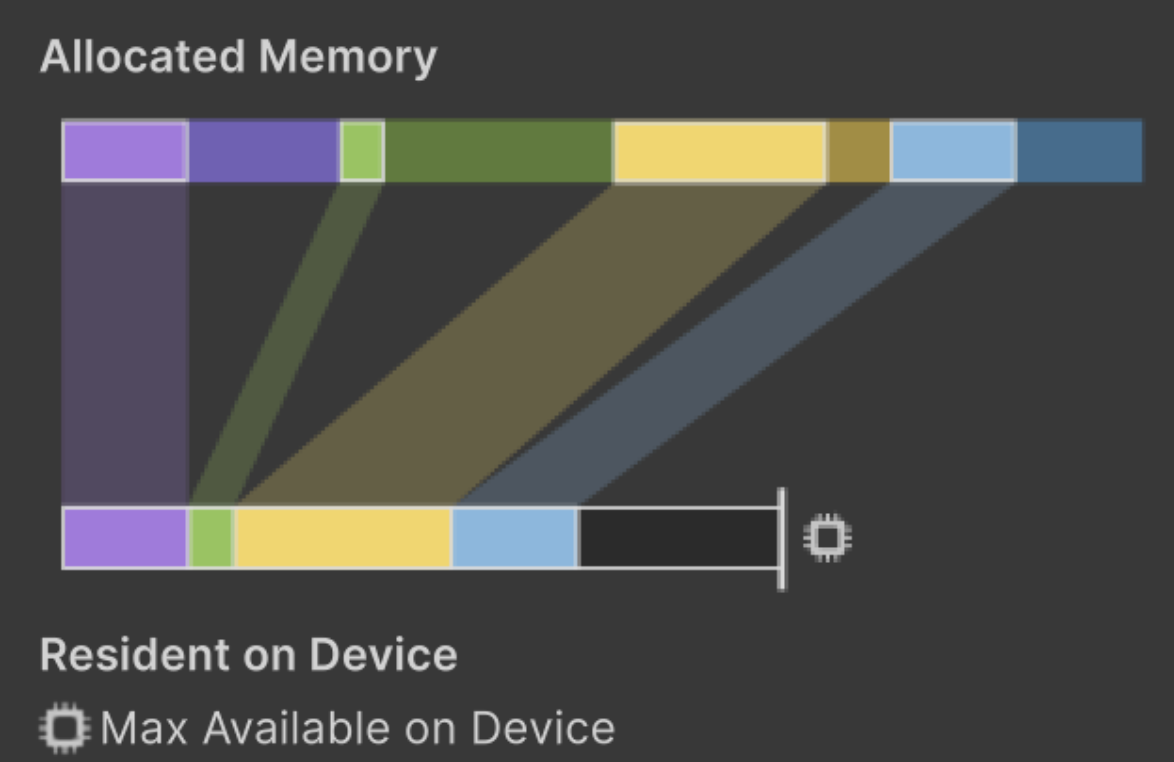
- Resident Memory: the portion of allocated memory that is actually resident in physical memory.
- Example: 500MB virtual allocation with 10% resident ratio.
50MB resident in physical memory + 450MB allocated only in virtual memory.
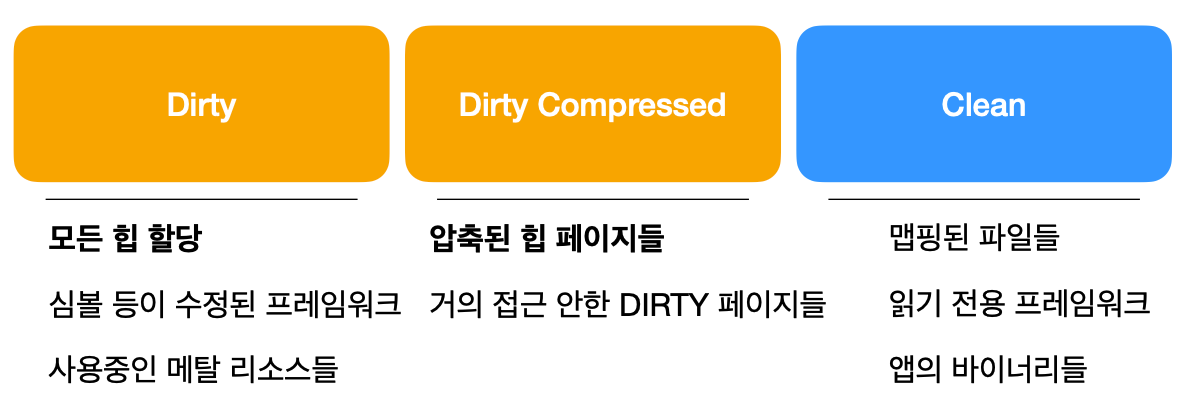
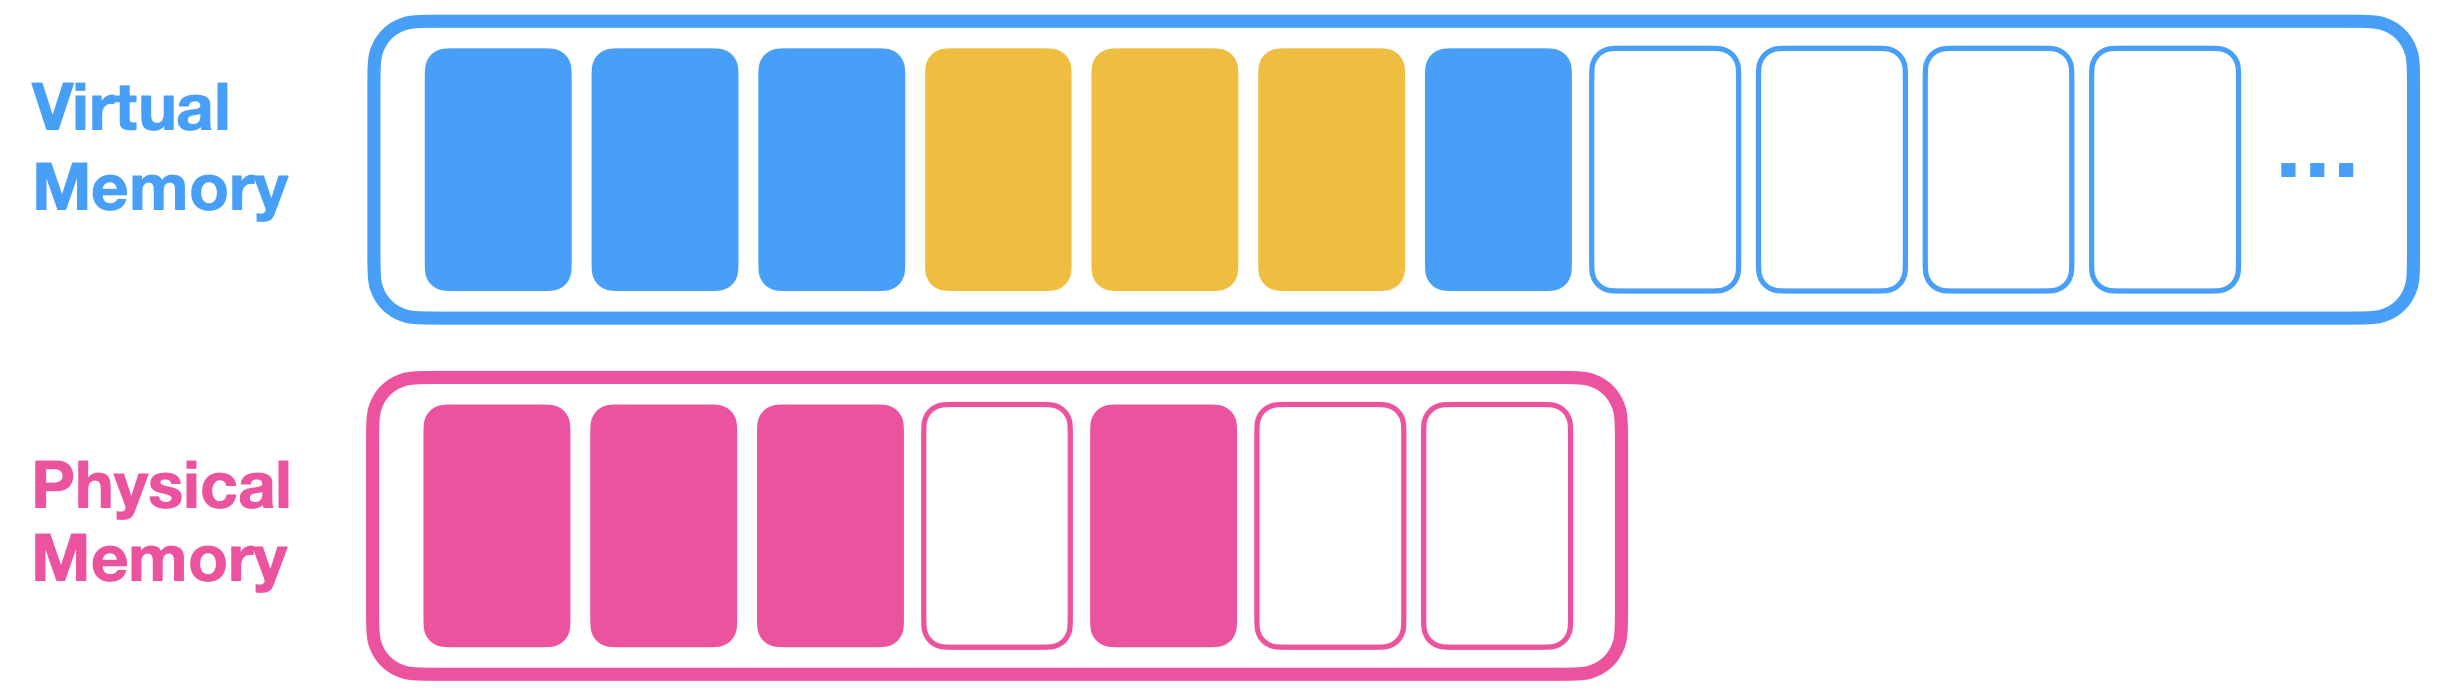
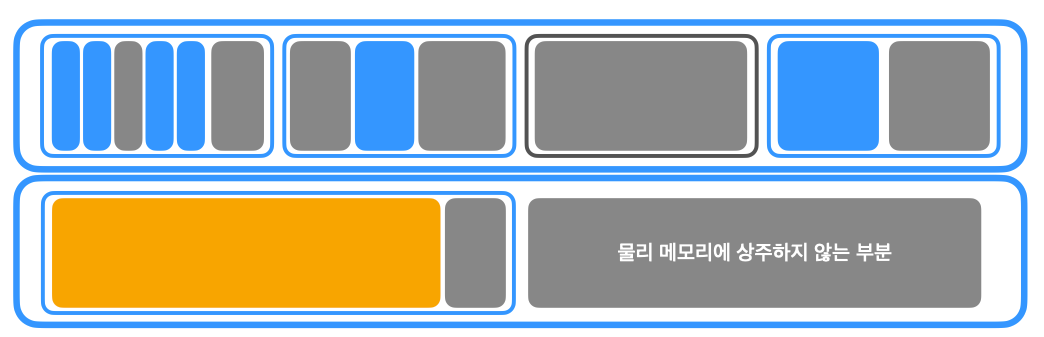
- In general, app memory profiles are composed of Dirty, Compressed, and Clean segments.
- Dirty: heap allocations, modified framework regions (symbols, etc.), active graphics API resources (Metal).
Memory written by the app. It may include decoded image buffers.
- Dirty Compressed: Dirty pages that are rarely accessed.
Disk swap is possible. Unaccessed pages can be compressed to make more usable space, and decompressed on access.
1
2
What is disk swap?
When physical memory is full, disk space is temporarily used like memory via swapping.
- Clean: mapped files, read-only frameworks, app binaries (static code). These can be removed from physical memory anytime, and usually have low residency.

- Dirty and Dirty Compressed are part of memory footprint and have high residency.
- Clean generally has low residency.
Summary
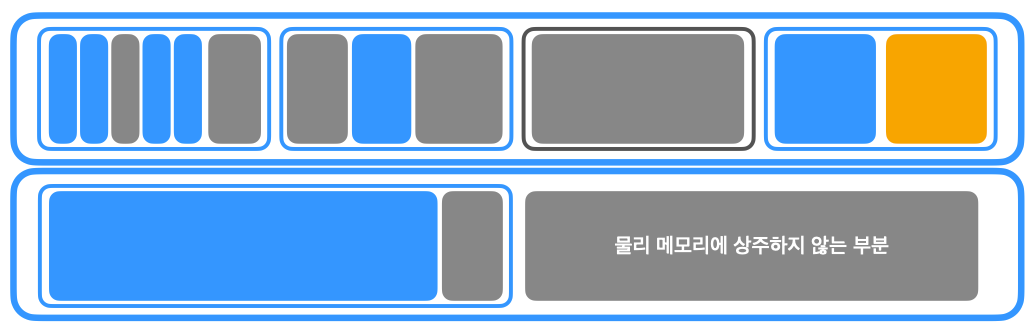
- Why is total current physical memory usage (resident memory) not equal to footprint?
Because Clean resident pages can be released at any time.
Dirty resident pages are hard to release. - Dirty means the minimum physical memory that must exist.
Since practical physical-memory limits are constrained by Dirty usage, Dirty is effectively the memory footprint.
- Dirty memory is the primary optimization target.
Example: dynamic allocations.
However, excessively large Clean memory can also hurt performance due to frequent swap overhead.
Dirty memory should be the top optimization focus (dynamic allocations).
If Clean memory causes frequent swaps, overhead increases.
iOS Memory Limits
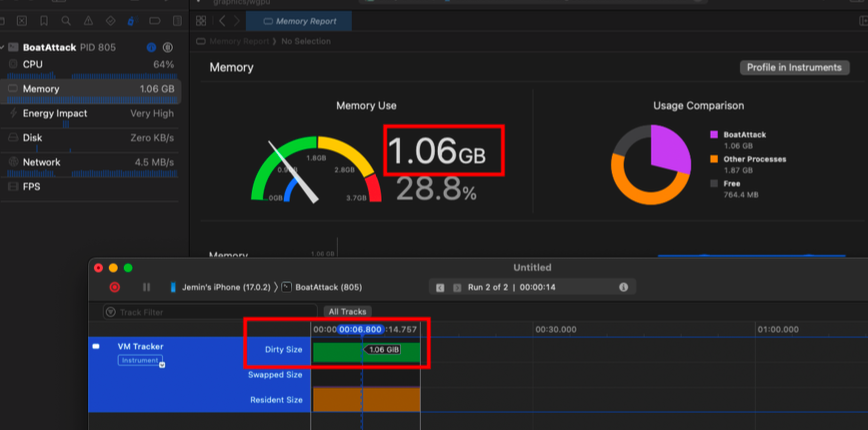
- Memory shown in Xcode debugger is Dirty memory usage.
- In the example image, virtual memory allocation exceeds 2GB.
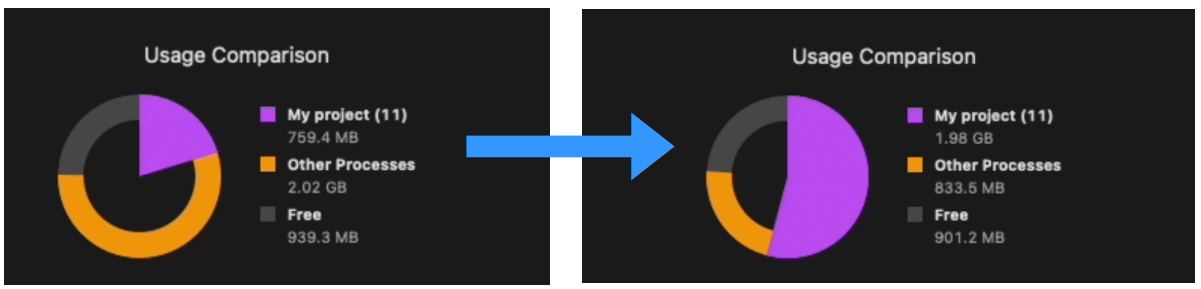
- What happens when an app’s Dirty memory grows?
The system releases app Clean resident pages to secure physical space for Dirty pages.
It also reduces memory usage of other background processes.
- The maximum usable memory budget for an app is calculated based on Dirty memory.
What contributes to memory footprint in Unity?
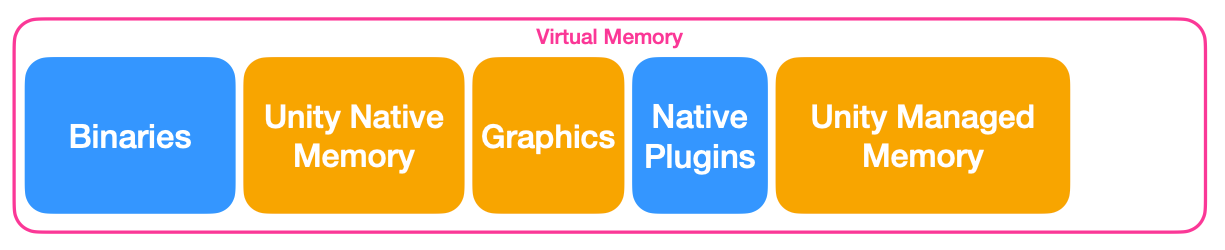
- Unity Native Memory
Unity C++ layer: loading a
Texture2Din C# also loads corresponding C++Texture2Dobject data.
Mostly Dirty memory.1 2 3
Why C++ when we write C# code? Unity is a C++ engine that runs a .NET VM. Unity core is C++, and .NET/C# scripts control it.
- Graphics
On mobile, GPU and CPU share memory (Unified Memory).
Texture/shader graphics resources (Metal resources).
Graphics driver memory.
Mostly Dirty memory. - Native Plugins
Plugin code binaries are Clean memory.
Native plugin runtime allocations are Dirty memory. - Unity Managed Memory
Memory controlled by the .NET VM.
Memory used by Unity C# script layer.
Most dynamic allocations are Dirty memory.
- Binaries and native plugin binaries -> Clean memory
- The rest -> mostly Dirty memory
Unity Memory Architecture
Native and managed scripts
- Unity is a C++ engine using a .NET VM.
- There are two layers:
Native code (C++)
Managed scripts (.NET, C#) - When an asset is loaded, memory often appears as combined C# side + C++ side usage.
About game object binding
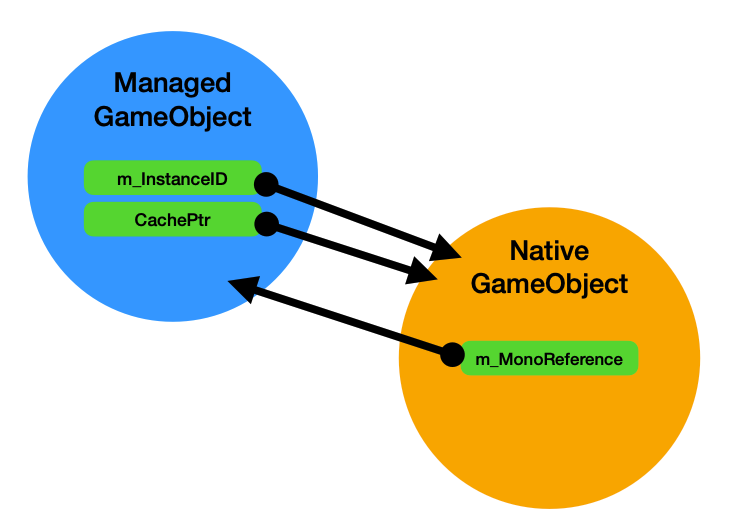
- A .NET object inheriting
UnityEngine.Object - Linked with a C++ native instance
Memory regions
- Managed Memory: automatically managed memory region.
- Native Memory: memory used by engine C++ layer.
C# Unmanaged Memory: C# memory not managed by GC -> used by Job System, Burst Compiler, etc.
- Example: Font asset
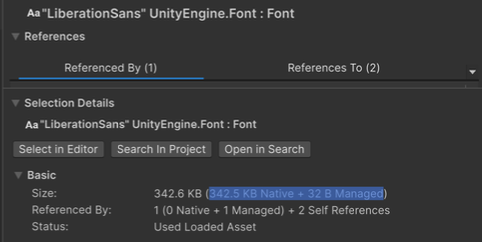
- 342.5 KB native memory
- 32 B managed script memory
Managed Memory
- Region allocated/controlled by the scripting backend VM.
- Managed Heap: all C# allocations (dynamic allocations).
- C# scripting stack: local variables.
- Native VM memory: memory for VM runtime itself, scripting internals, metadata for reflection/generic support.
- Allocations are managed/cleaned by GC (Garbage Collection).
- Managed-target allocations appear as
GC AllocationorGC.Alloc.
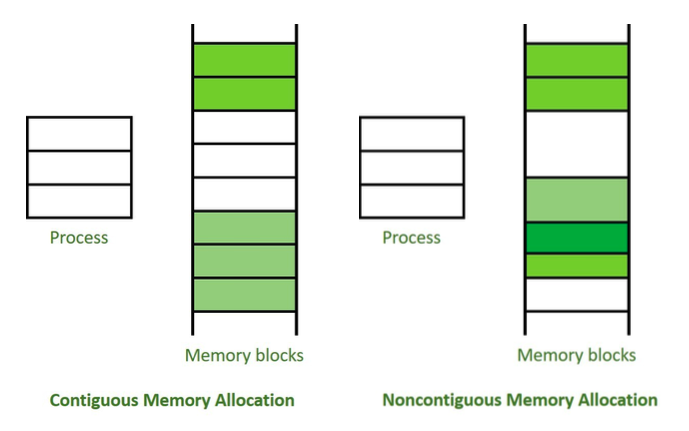
Managed Memory: actual behavior
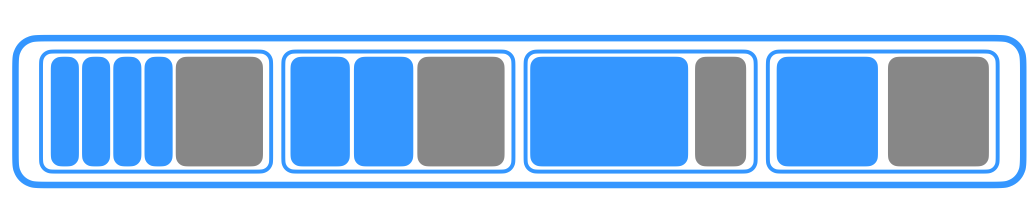
- Secure memory pool -> split blocks in a region for similarly sized objects.
Group similar sizes into blocks.
- New objects are allocated inside blocks.
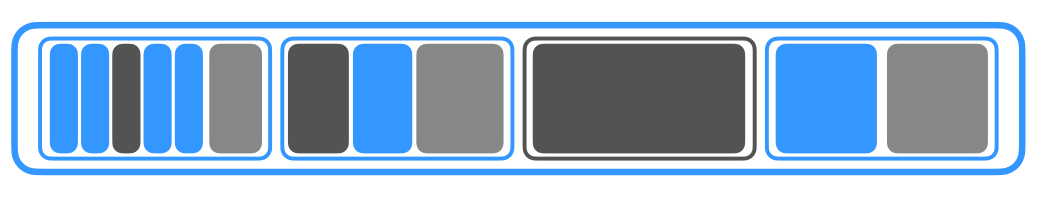
- When objects are destroyed, they are removed from blocks.
- Memory fragmentation can occur.
- Completely empty blocks can be returned to the OS.
- Completely empty blocks are decommitted
- Still reserved in VM, but no longer mapped to physical memory
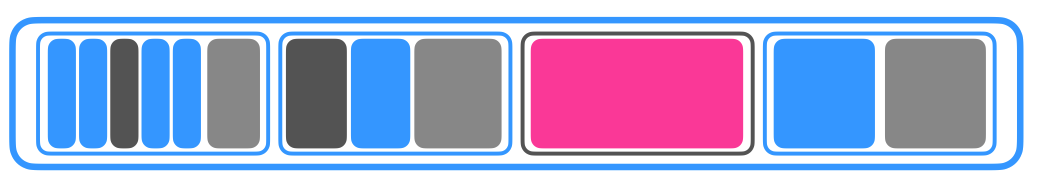
- If a new allocation does not fit existing blocks, a new memory region is reserved.
- Allocations larger than default block size create custom blocks.
- Unallocated spaces inside regions are not mapped to physical memory.
- Existing blocks can be reused for similarly sized object allocations.
- If an entire memory region is released, it may remain reserved in virtual memory but returned (decommitted) from physical memory.
- If a new allocation cannot fit existing blocks -> create/allocate a custom block.
Analyzing Unity Memory Profiler
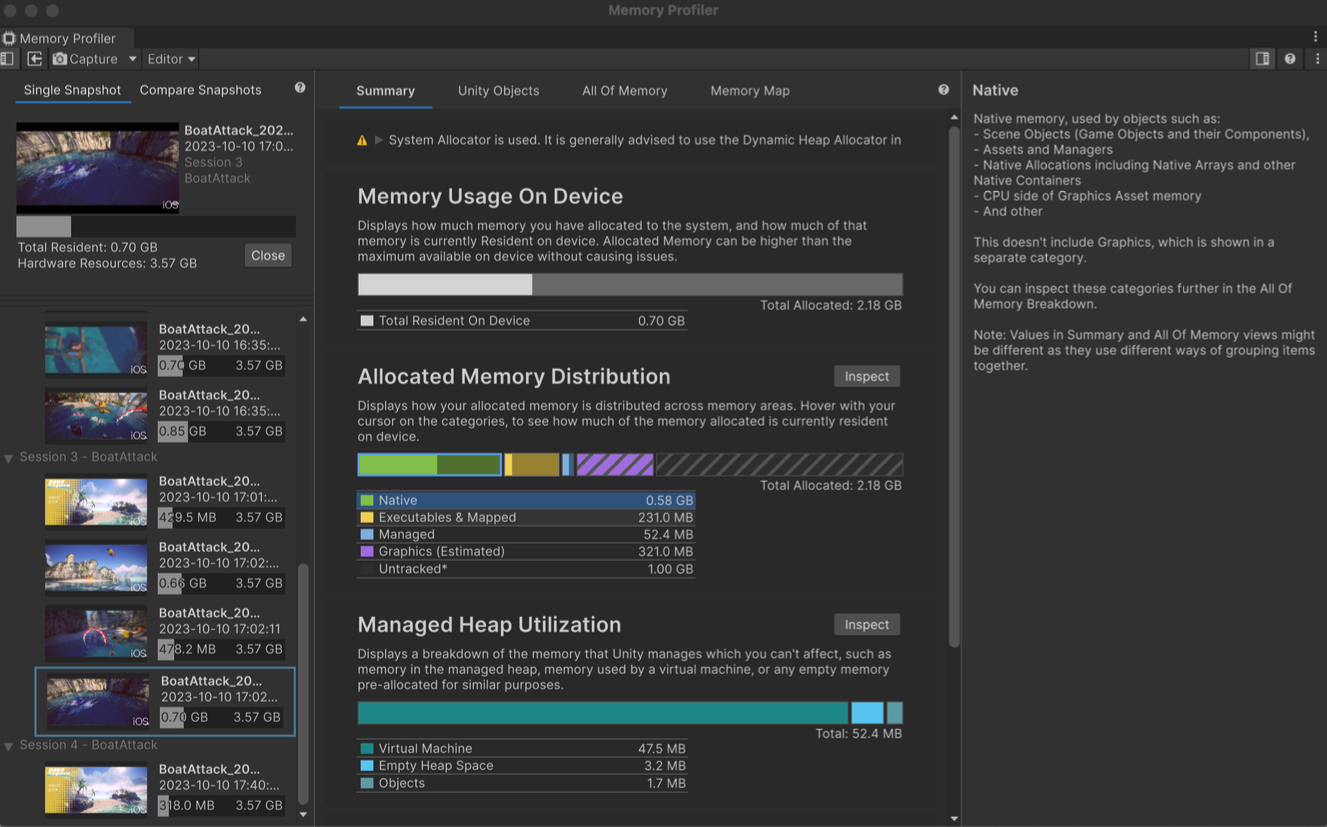
Summaries tab
Memory Usage On Devices: memory usage on device.Allocated Memory Distribution: VM allocation distribution.Managed Heap Utilization: heap utilization.Top Unity Objects: Unity objects consuming most memory.
- Memory Usage On Devices
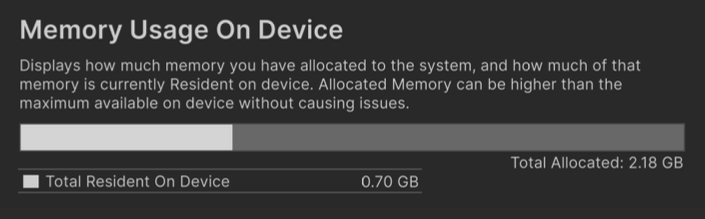
Total Resident: resident memory.Total Allocated: allocated size.
- Allocated Memory Distribution
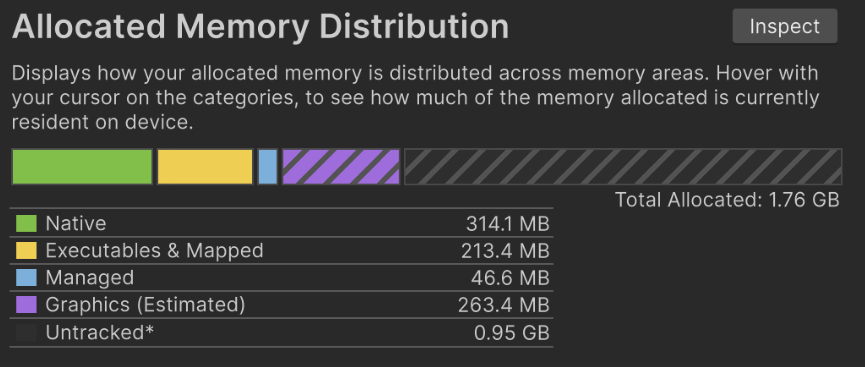
- VM allocation distribution by category.
- Native: Native C++ memory.
- Graphics: GPU allocation via Metal.
- Managed: C# memory.
- Executable & Mapped: Clean memory, binaries, DLLs.
Untracked: unknown symbols or ambiguous categories -> category mapping is not perfect (e.g., audio clips).
- Categories are not perfect!
Some allocations are ambiguous.
Some cannot be classified.
Classification policy can differ by Unity version. Unknown,Others,Untrackedmean allocations Unity cannot classify.Example: plugin allocations (e.g., login via Android plugin), other allocations created by the Unity app.
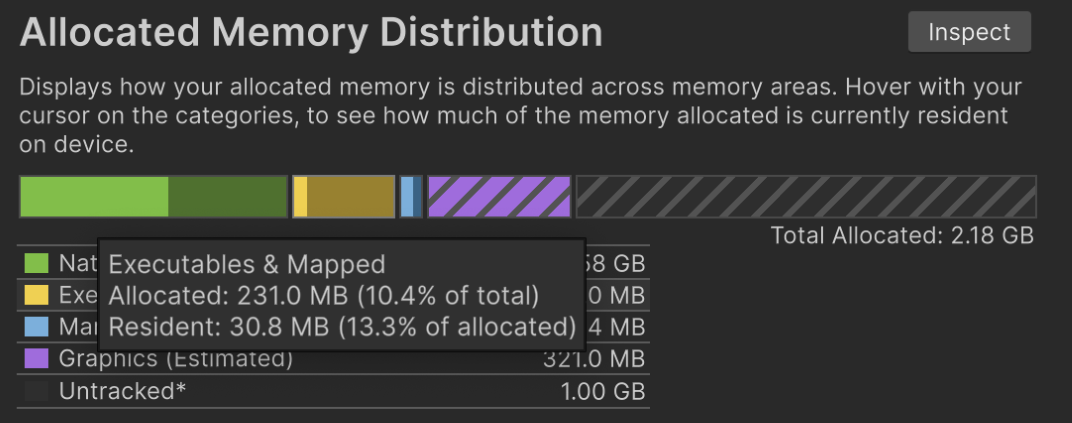
- It also shows resident memory ratio.
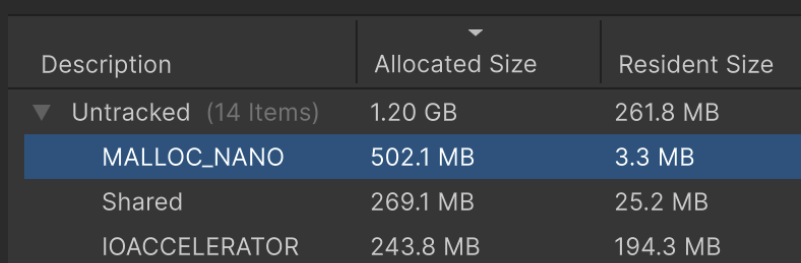
- Large
Untrackeddoes not always mean a problem. - Example:
MALLOC_NANORepresents pre-reserved heap space.
Allocated size: 502.1 MB
Resident memory: 3.3 MB
- Managed Heap Utilization
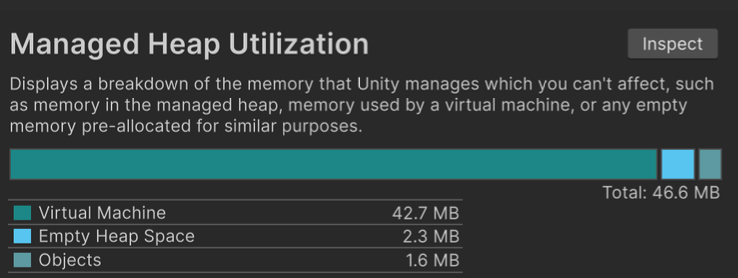
- Shows heap utilization.
This is not easy to control directly.
- Virtual Machine
- Empty Heap Space
- Objects
- Virtual Machine
- VM allocation for scripting runtime itself.
- Generics, type metadata, reflection.
- Tends to keep growing during runtime.
- Ways to reduce
- Code stripping
```
- Code stripping
- Engine code strip: strips Unity engine module code not used in app build
- Managed Code Strip Level Use both. If reflection is used, runtime errors can occur, so preserve specific classes in link.xml. ```
- Avoid reflection where possible
- Generic sharing (Unity 2022+)
- Empty Heap Space
- Empty heap space.
- Can accept new allocations.
- May include abandoned objects pending next GC.
- Excludes pages unmapped from PM.
If
Empty Heap Sizeis large, fragmentation is likely severe -> allocation CPU overhead rises and unnecessary memory occupation grows.Older versions
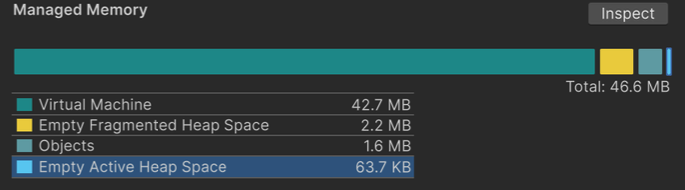
- Older versions split into
ActiveandFragmented. Active Empty Heap Space: empty region in contiguous heap blocks (higher priority).Fragmented Empty Heap Space: empty region in fragmented heap blocks.- There is little users can do directly about fragmentation itself.
- Older versions split into
- GC execution structure
- Empty-block formation follows an algorithm.
- New allocation occurs.
- First try allocating from contiguous empty heap space (
Active Empty Heap Space) (fast). - Then scan full empty-block lists and remaining heap space (slow).
- If still no space, trigger GC collection.
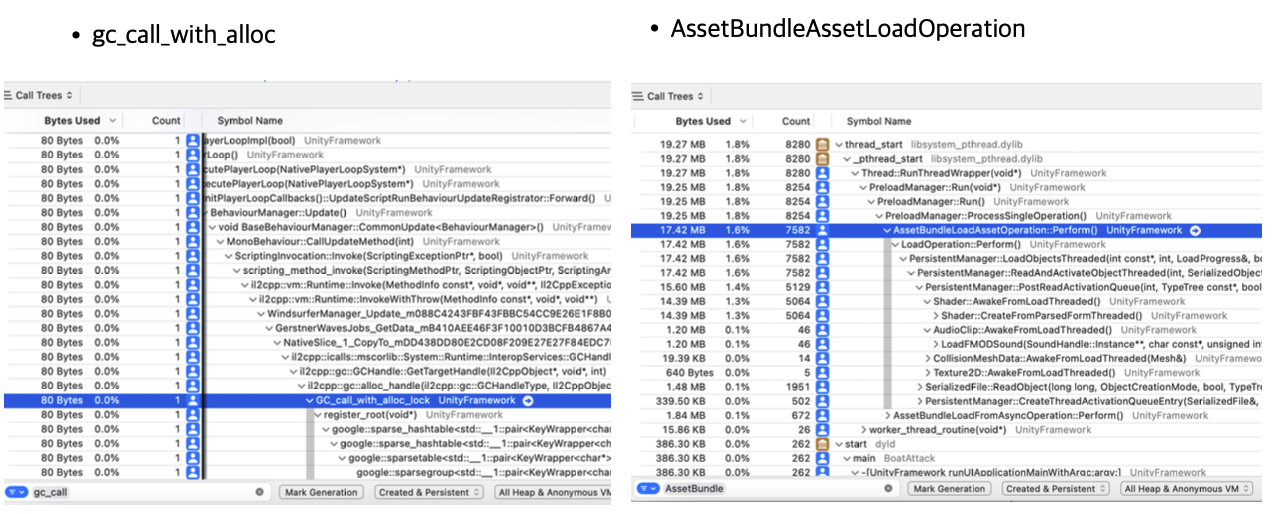
- With Incremental GC, heap can expand together with GC collection.
Marked as symbol
gc_call_with_alloc. - Without Incremental GC, if space is still insufficient after GC collection, heap expands.
gc_expand_hp_inner - Incremental GC is recommended.
Unity Objects tab
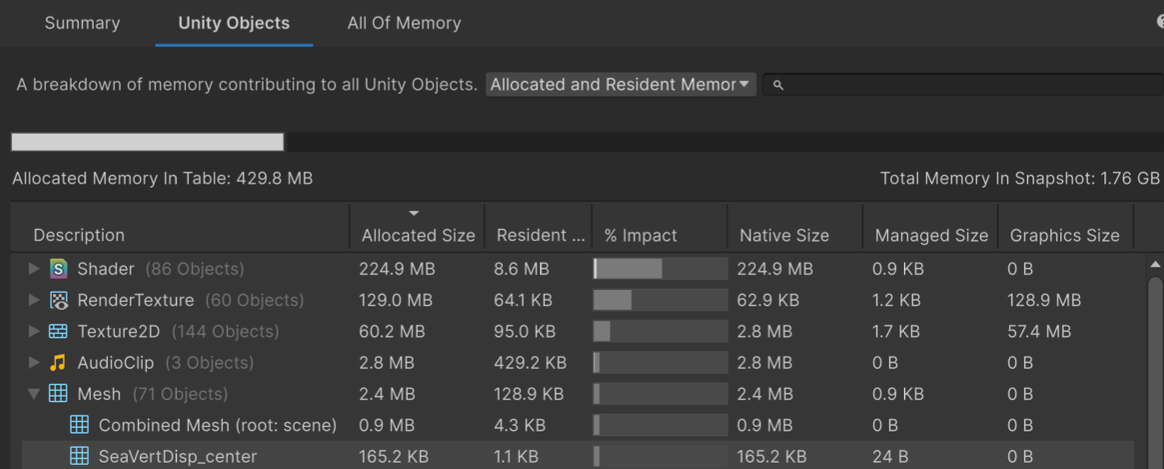
- Shows allocation sizes of Unity objects.
- Displays three dimensions:
Native Size(C++),Managed Size(C#),Graphics Size. - Also shows resident memory ratio.
All of Memory tab
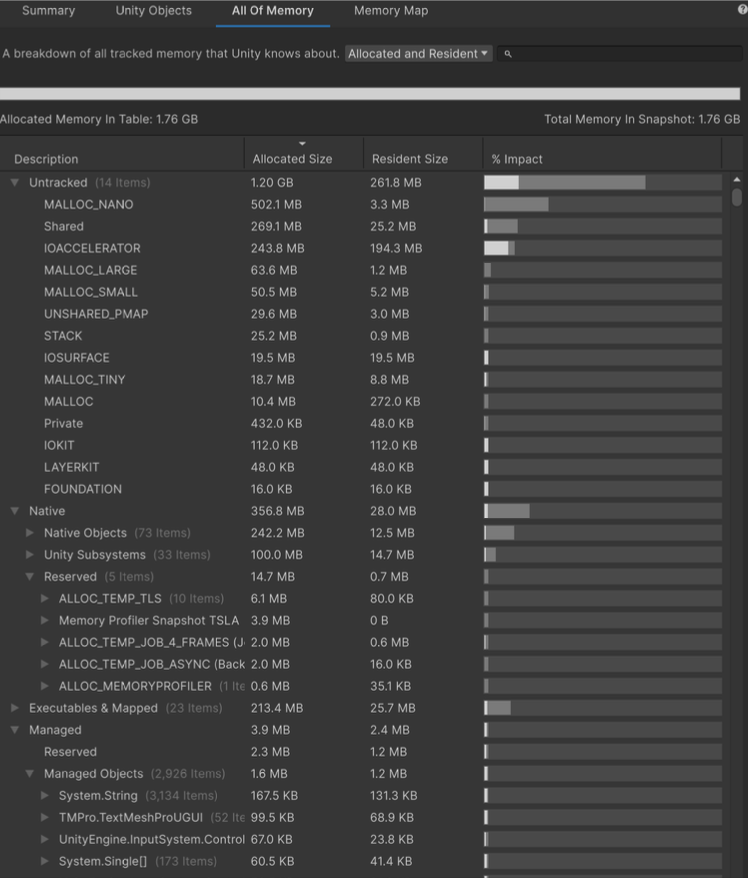
- Shows all VM allocated objects.
- Includes
UntrackedandReserved.
Memory Map
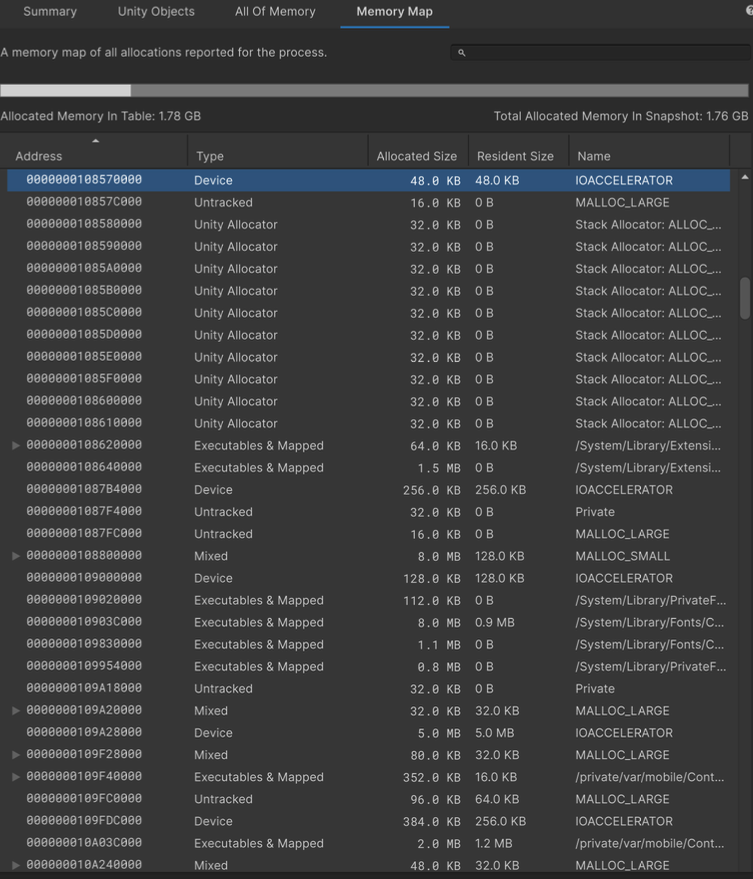
- Hidden feature.
- Per-page memory map.
- Lets you inspect which owner occupies each page.
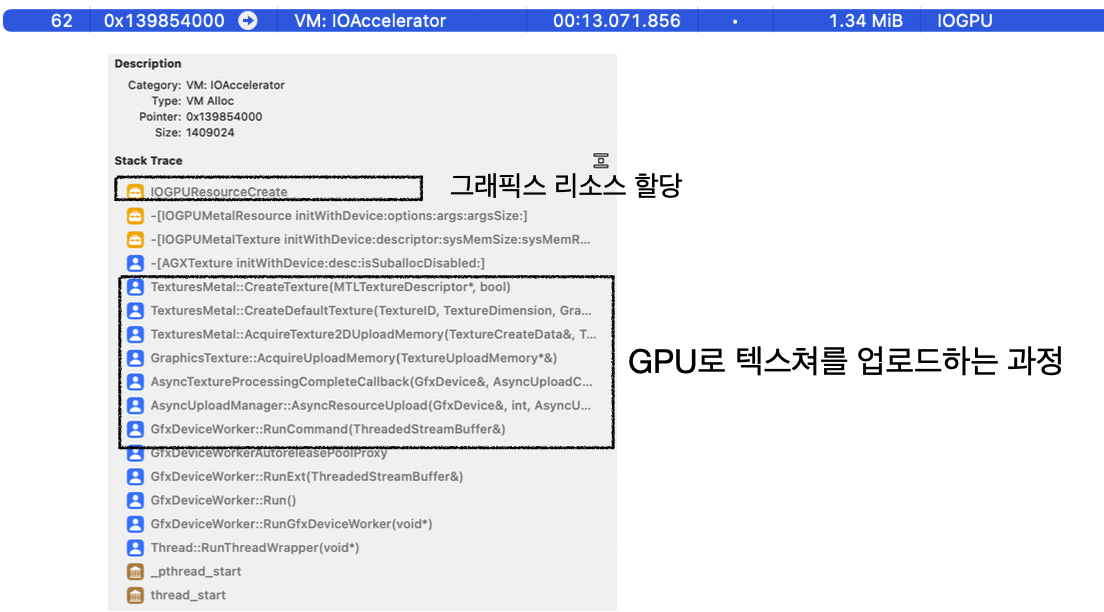
Device + IOACCELERATOR: allocations for GPU
Native Allocation: allocations from Unity native code - You cannot see concrete object names, but you can identify which framework/binary occupies memory.
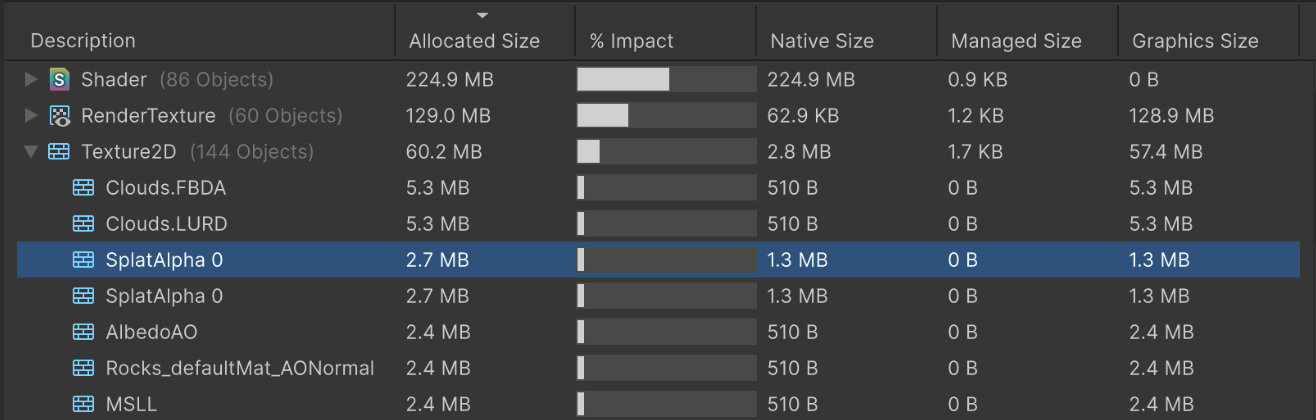
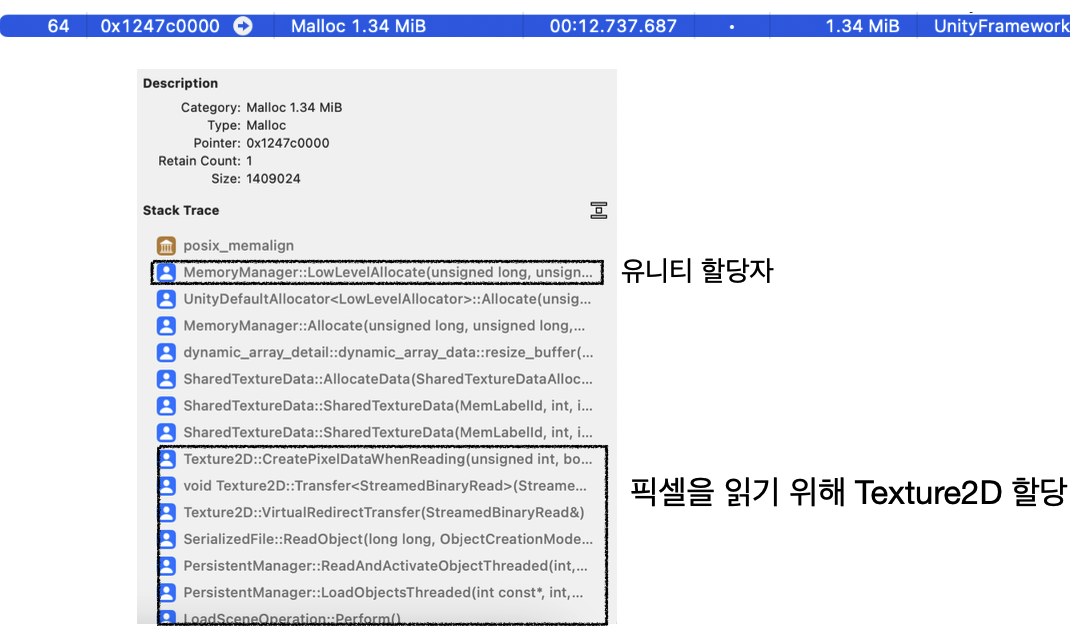
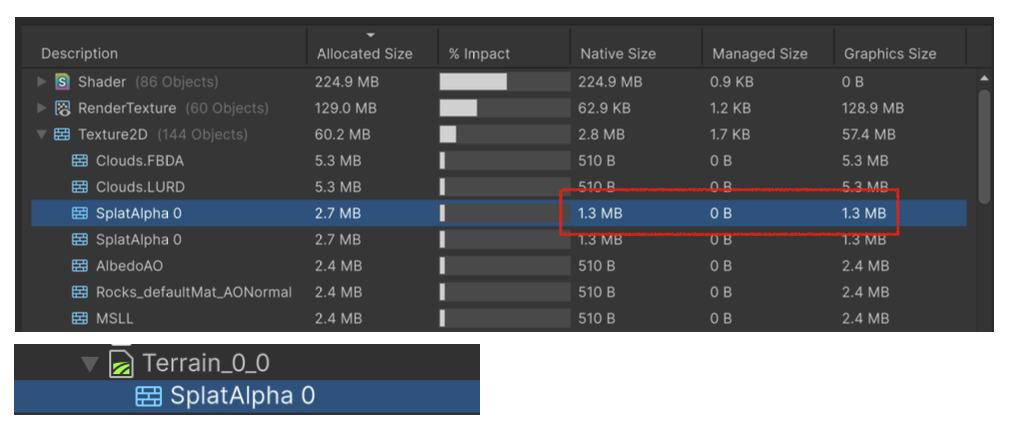
- Why does a 512x512 texture allocate 2.7MB?
- Native 1.3MB + Graphics 1.3MB?
- If you want to know when/why such allocation happened, use iOS native profiler.
- Memory Profiler is snapshot-based, so call-stack tracing is difficult.
Using Native Profiler: Xcode Instruments
- How to use Xcode Instruments
- Or launch Instruments directly from Xcode.
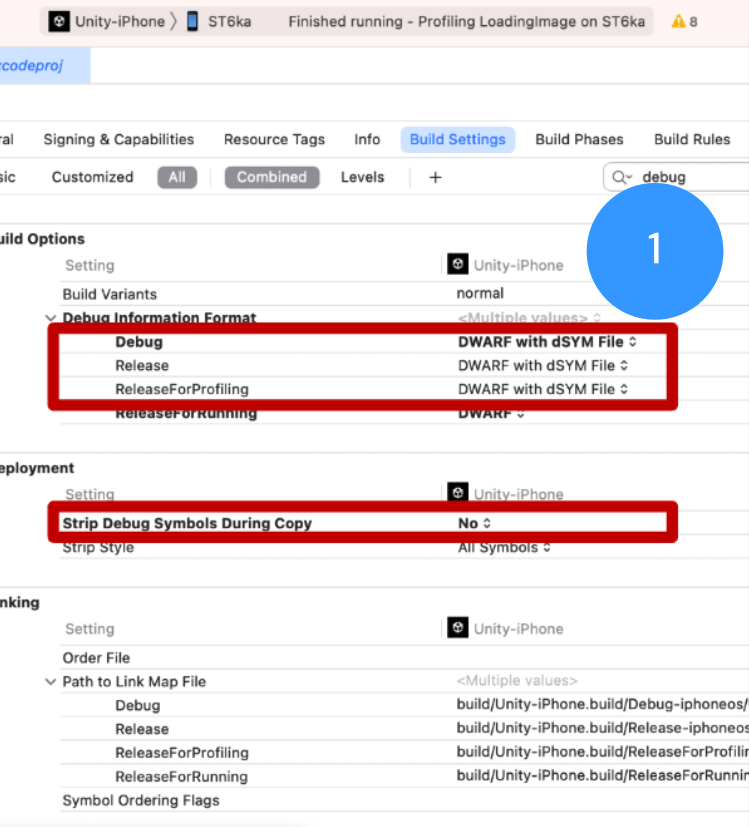
- In Xcode Build Settings, include debug symbols.
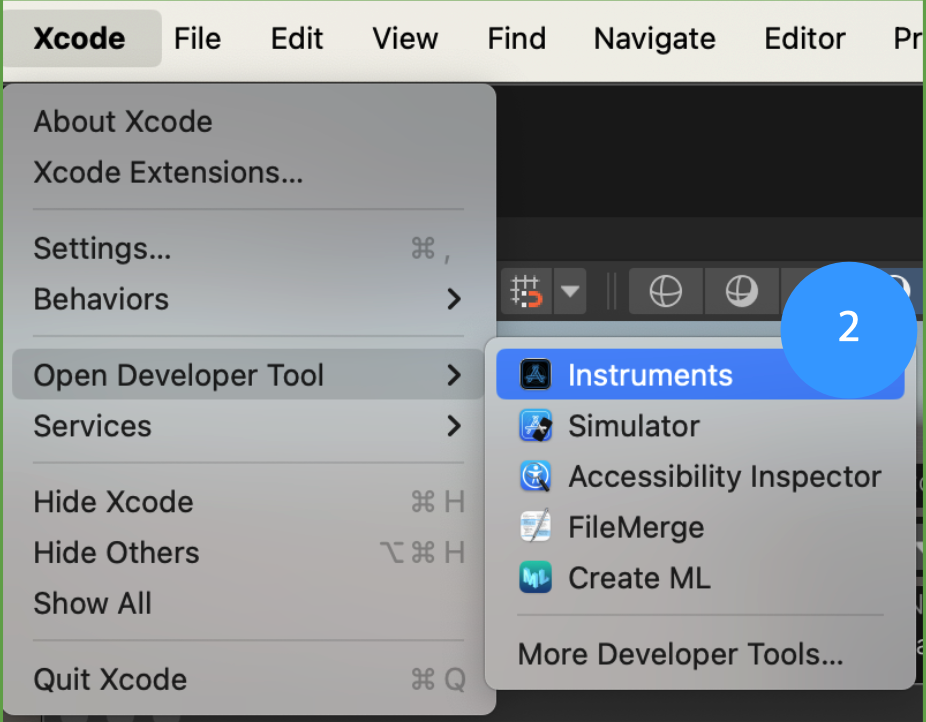
- Xcode -> Open Developer Tools
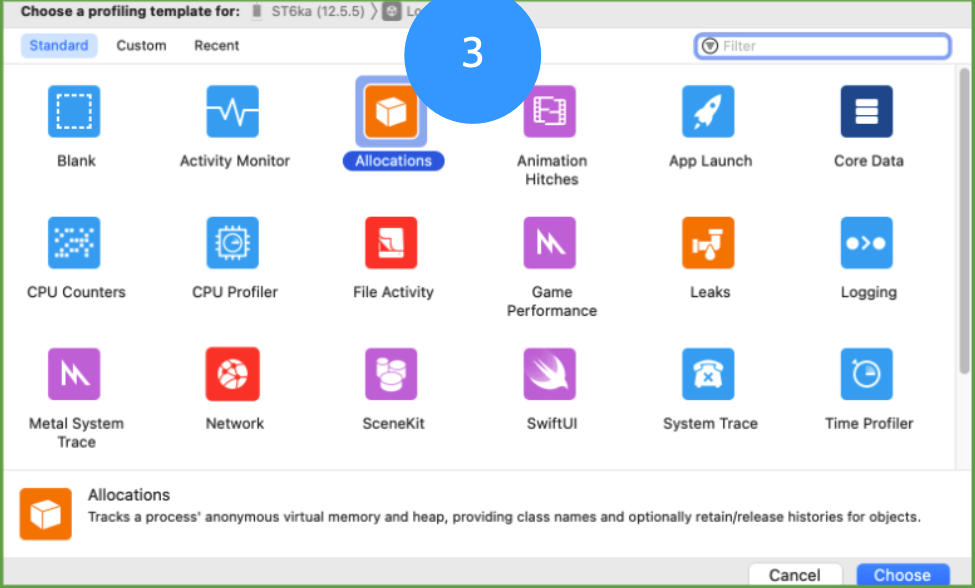
- Choose
Allocationstemplate in Instruments.
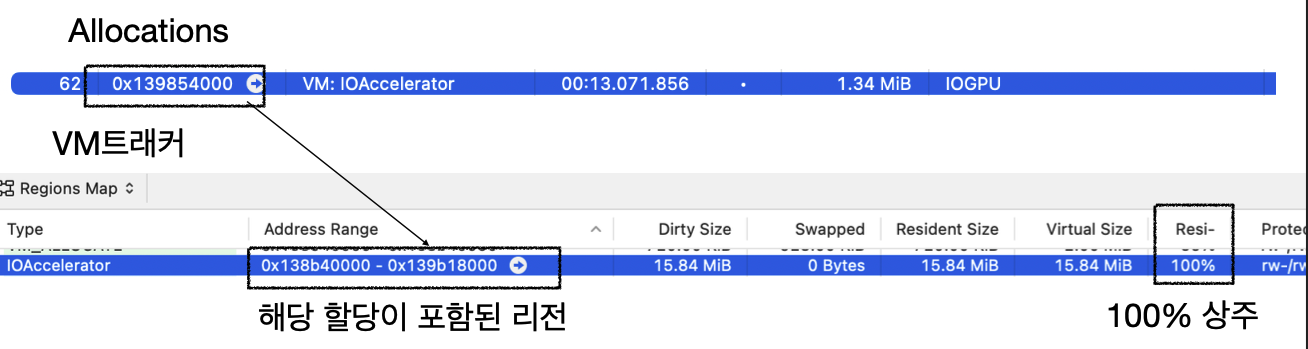
VM Tracker
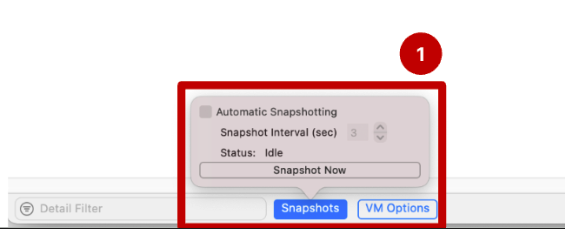
- You can inspect all VM allocations of the app.
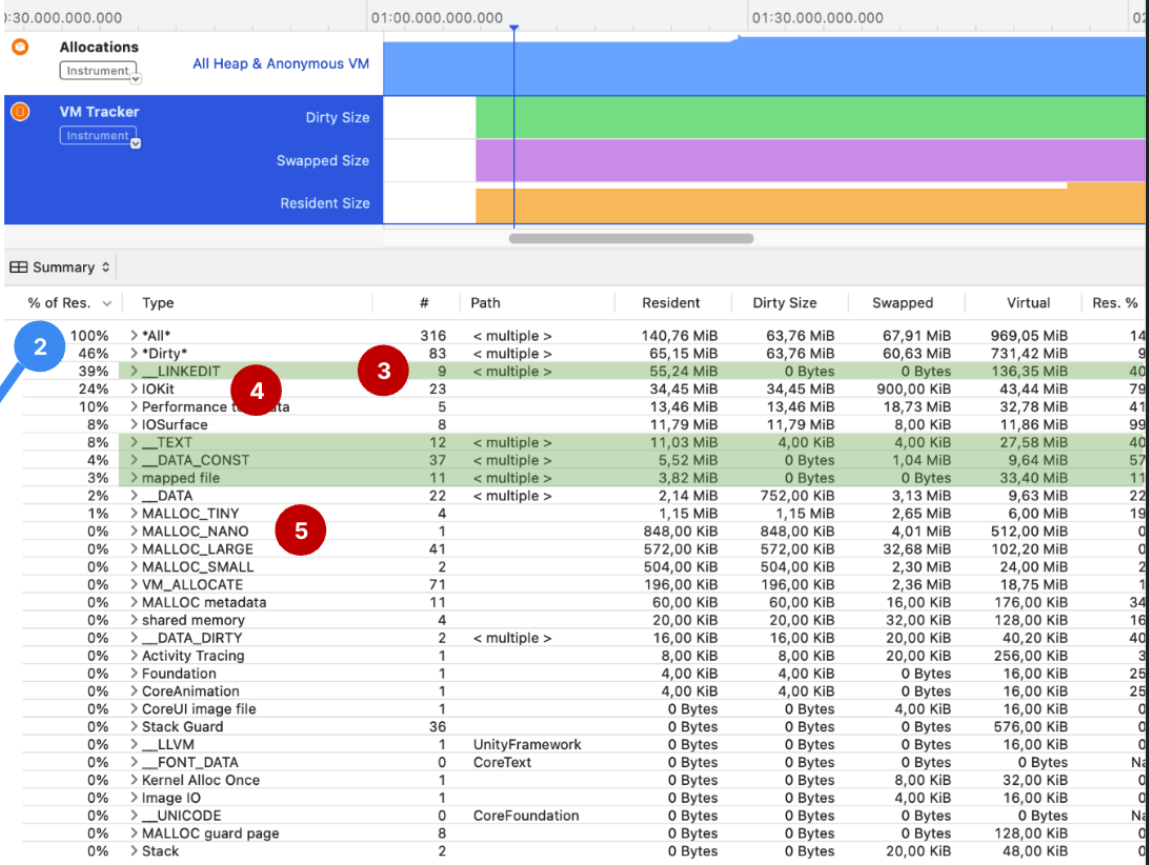
- Binaries/Code (Clean memory):
_LINKEDIT,_TEXT,_DATA,_DATA_CONST - “GPU”: Unity GPU-related processing (
IOKit,IOSurface,IOAccelerate) - App Allocations: Unity CPU-related processing (
Malloc_*,VM_ALLOCATE) - Performance tool data
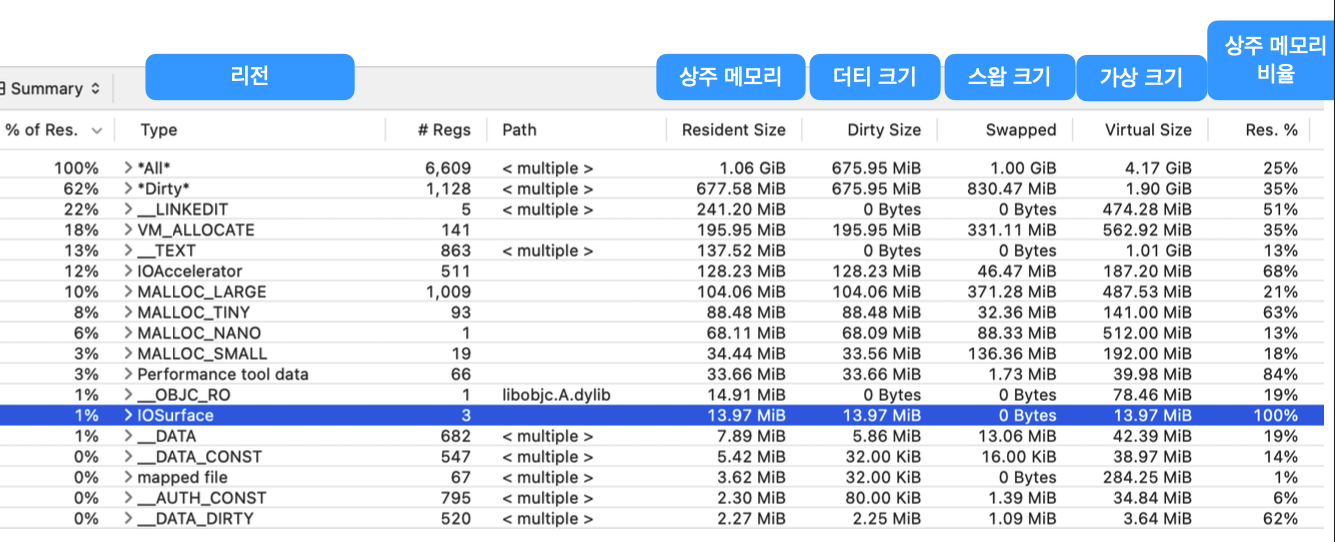
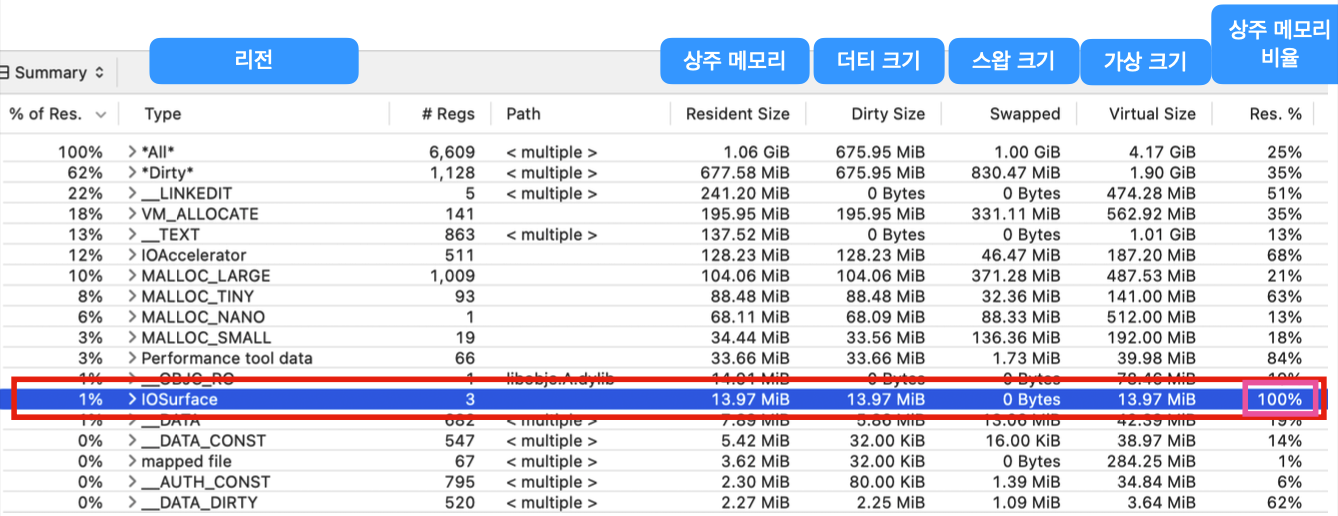
IOSurfacegraphics allocation has 100% resident ratio -> 100% physically allocated.- If this physical memory limit is exceeded, the app crashes.
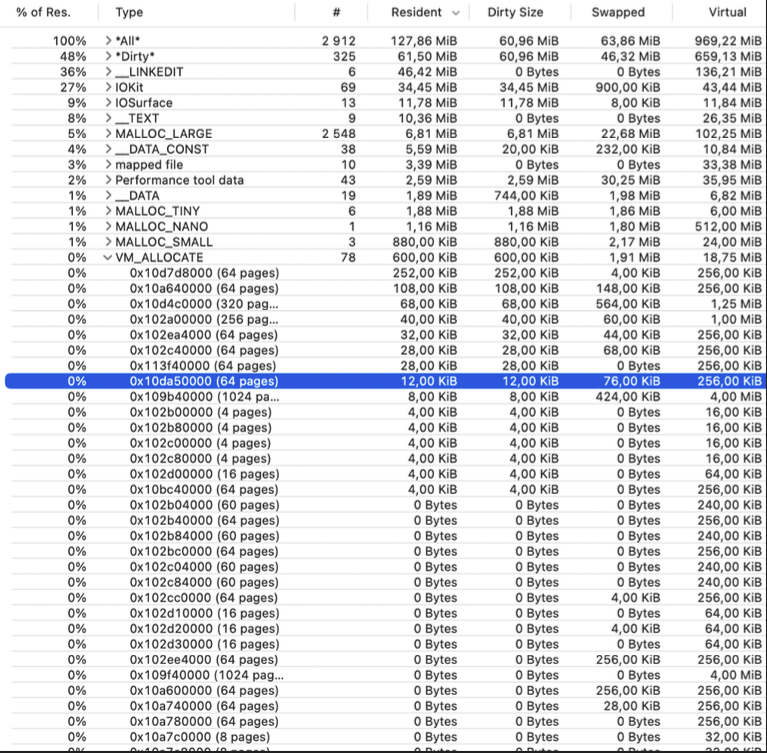
- Where is object
0x10da50000allocated?
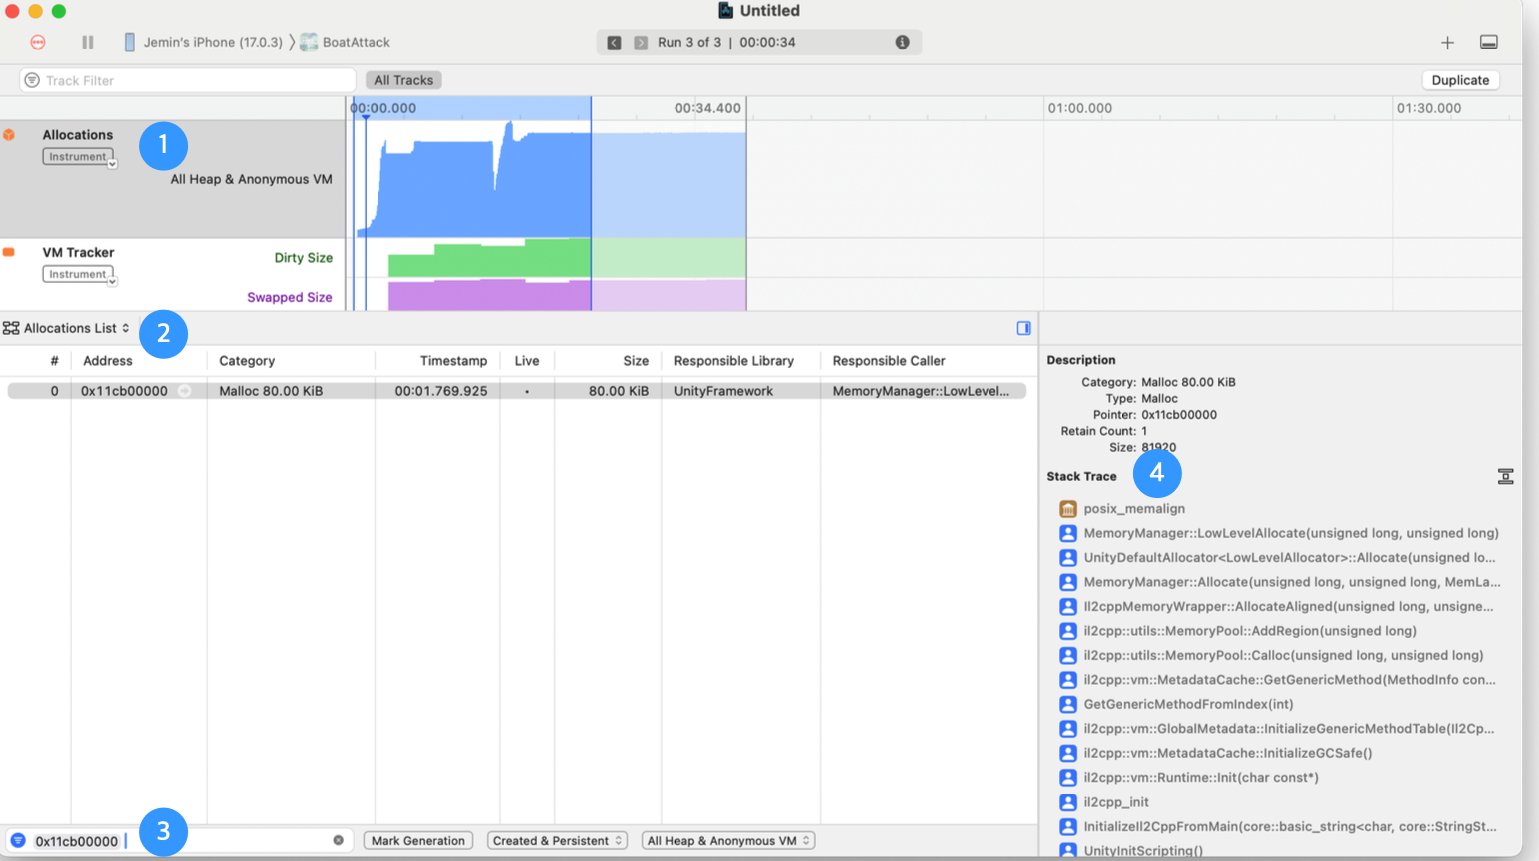
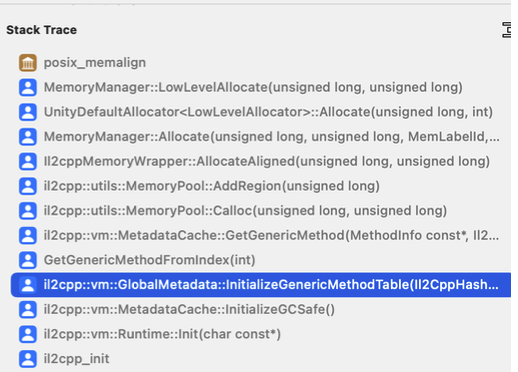
- You can confirm this is allocation during IL2CPP VM generic metadata table initialization.
Call stack search
- Search is available in the bottom search bar.
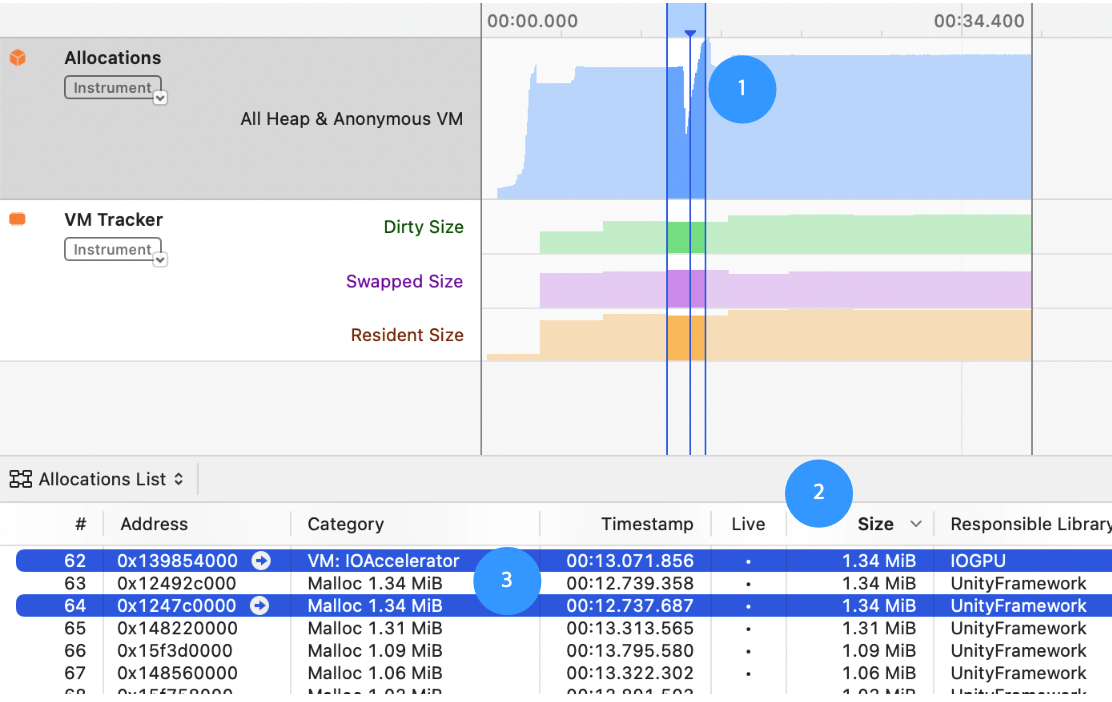
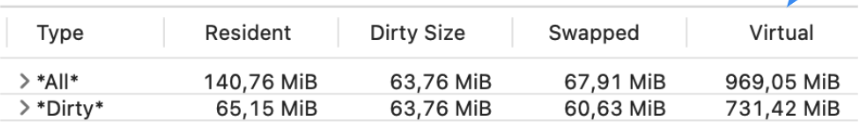
- dirty size: dirty portion inside virtual memory allocation; hard to evict from resident memory
- swapped: swapped pages
- resident: resident memory
- In
Allocations, you can also inspect resident memory ratio.
- Additional notes
Memory Graph: native memory snapshot tool.WWDC 2022 -
Profile and optimize your game's memory.Figure out why the app closes: memory issue or not?
While app is still running, take Memory Profiler snapshots to check whether memory usage is excessive.
Play with iOS Xcode debugger attached -> crash -> easier to capture crash cause.
Determine whether crash is from memory or from another error.
If it is a memory issue:
In Memory Profiler (
Unity Objects,Summaries), sort and inspect by largest regions inTotal Committed.- About layout processing
- Due to circular layout issues,
- Evaluate whether it is dirty and refresh layout at end of frame.
If layout always gets pushed to end of every frame, is there an API to force layout refresh?
- Other notes
- Mobile -> Unified memory
- Windows -> VRAM
- Texture read/write setting -> also consumes CPU memory copy