
Unity Profiler Optimization


Table of Contents
- 1. Unity Profiler structure
- 2. Profiler threads
- 3. Sample stack vs call stack
- 4. About markers
- 5. Finding bottlenecks
- 6. Graphics batching
Unity Profiler
- A tool that lets you optimize quickly either in the Editor or from development builds.
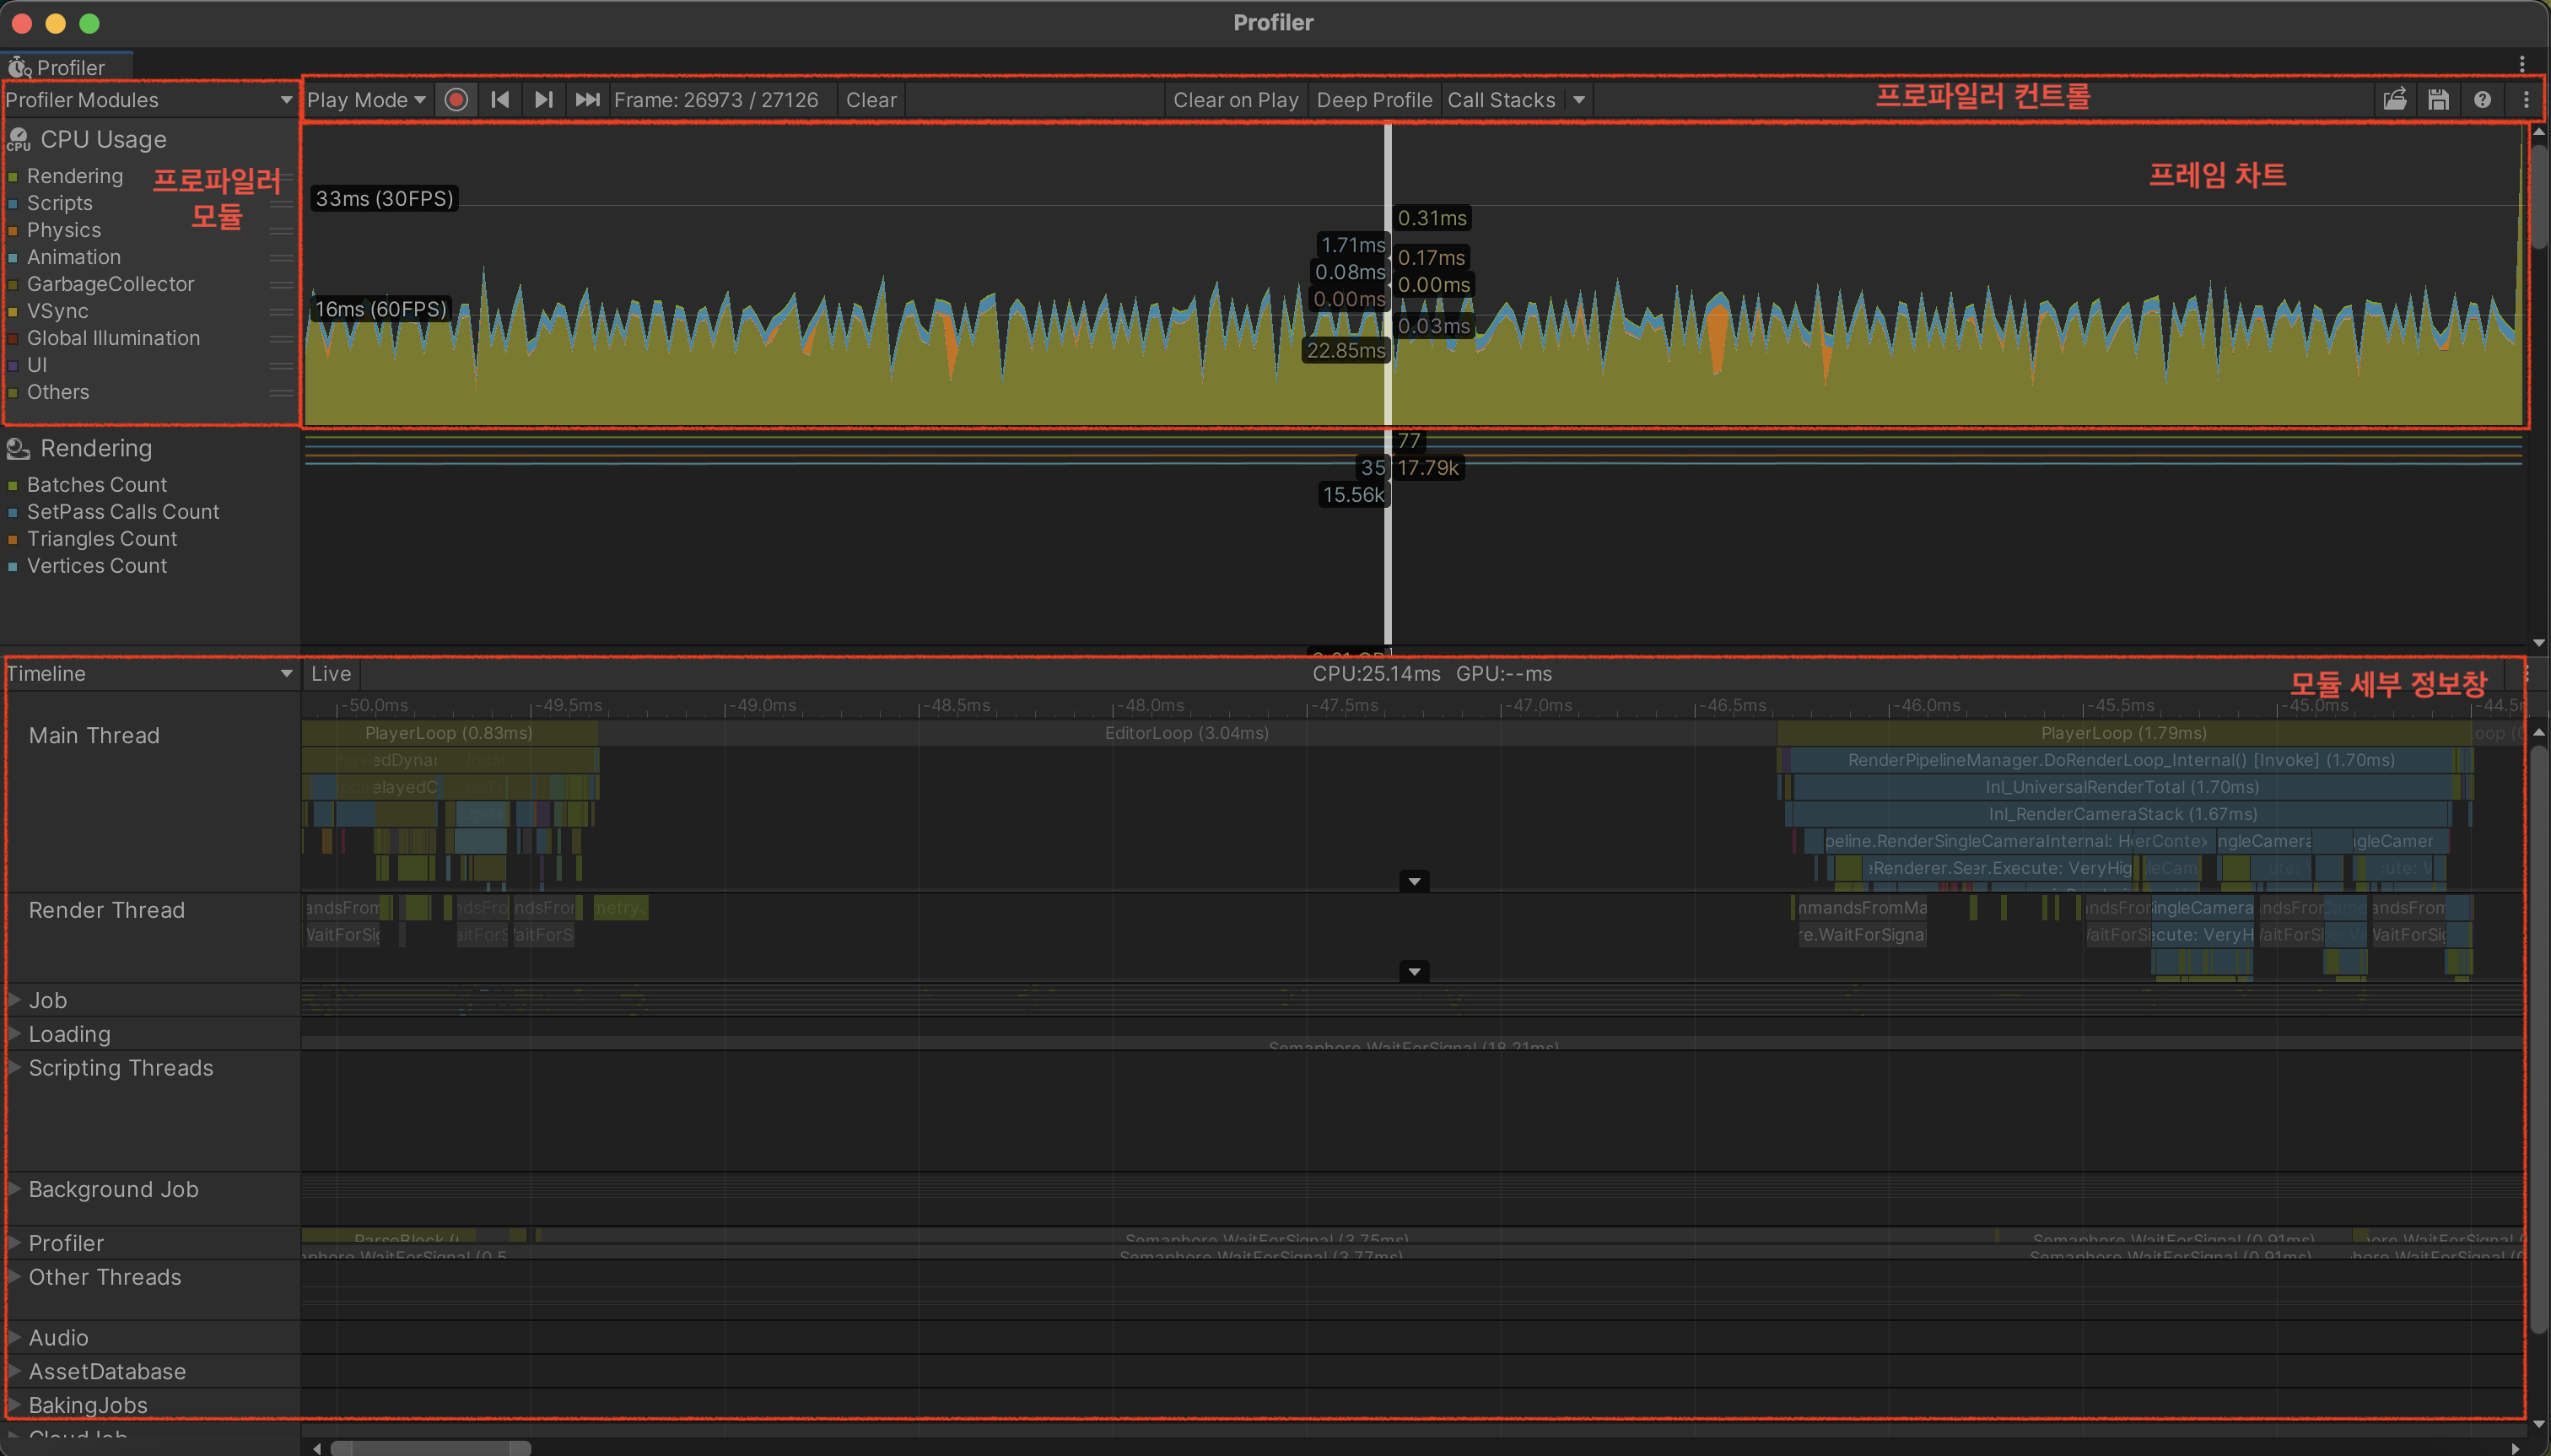
Unity Profiler structure
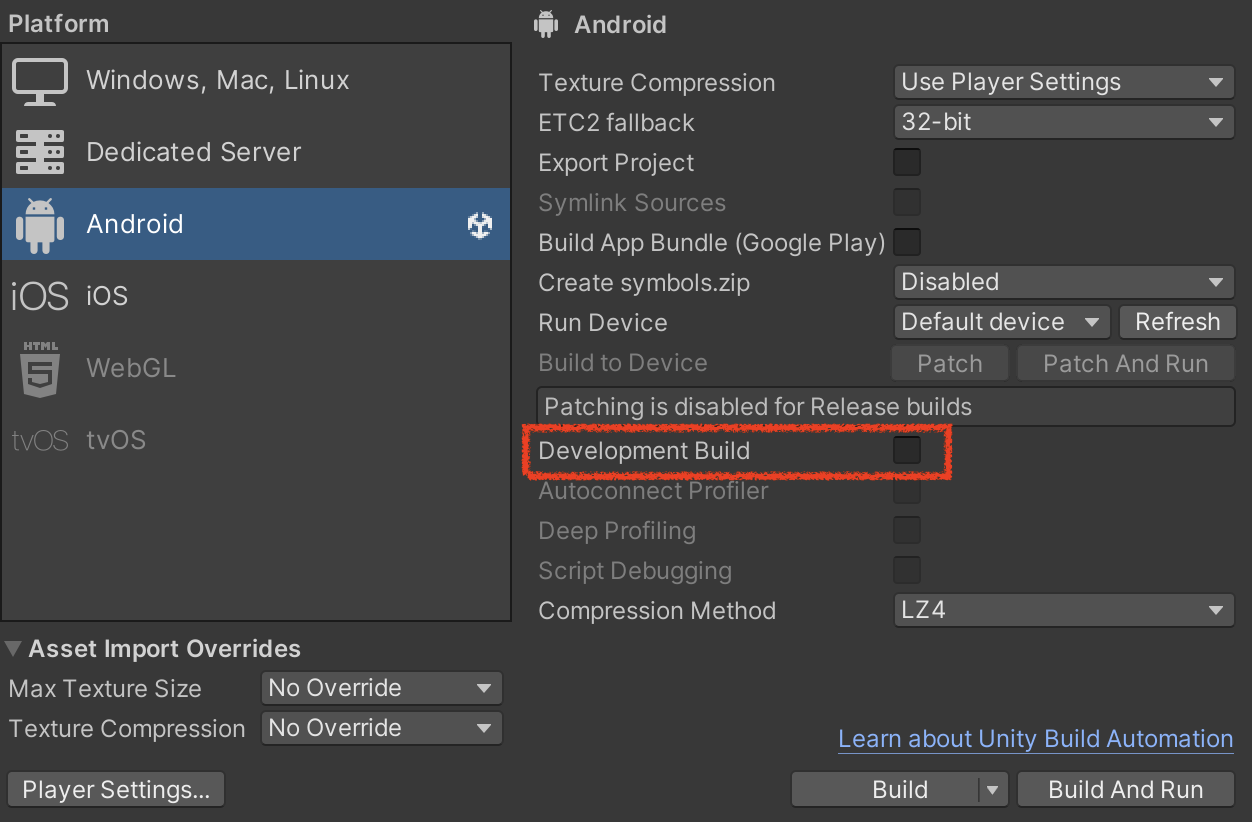
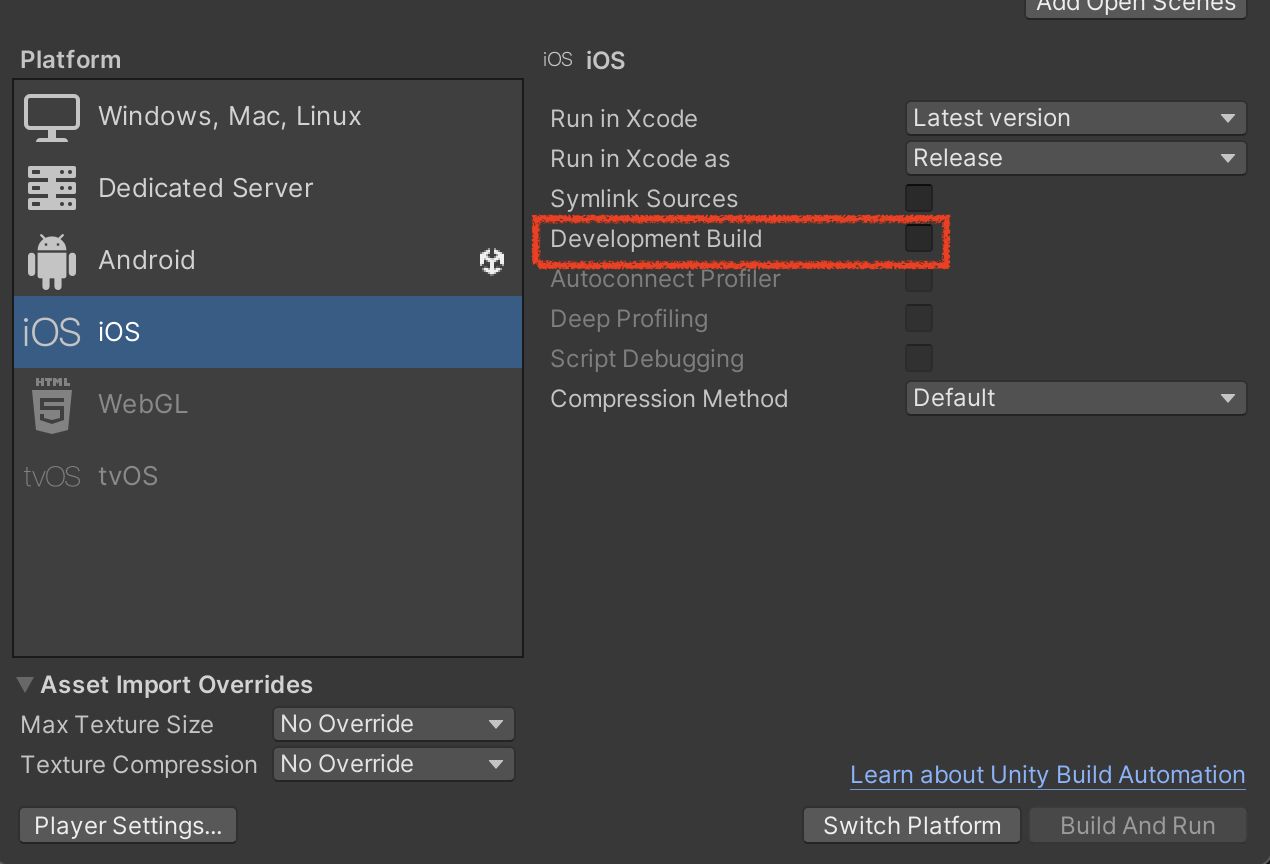
Enable the Development Build option
- Most additional options are not necessary. They mainly support auto profiler connection and deep profiling.
- Auto-connect bakes the current PC’s IP, so automatic connection works only from the machine used to build.
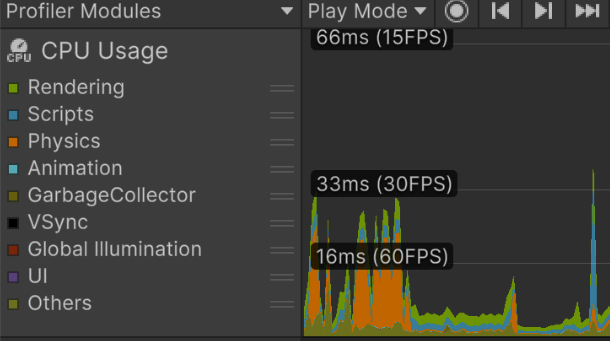
Profiler - CPU module
- You can inspect data per sample.
- You can verify how much CPU time each process consumes.
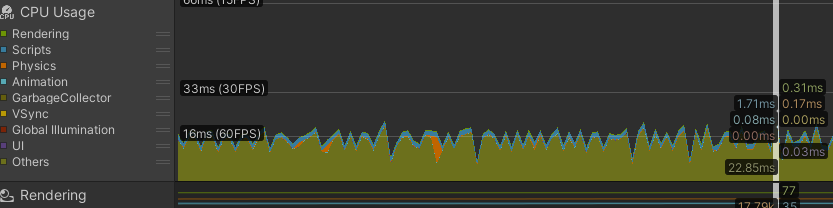
Profiler - Chart view
- Check whether the frame is processed faster than your target FPS. For 60 FPS, most work should finish within 16ms. For 30 FPS, within 33ms.
- Check whether graph overload spikes occur.
- If VSync is on, charts are effectively clamped around 60 FPS / 16ms. For profiling, turn VSync off.
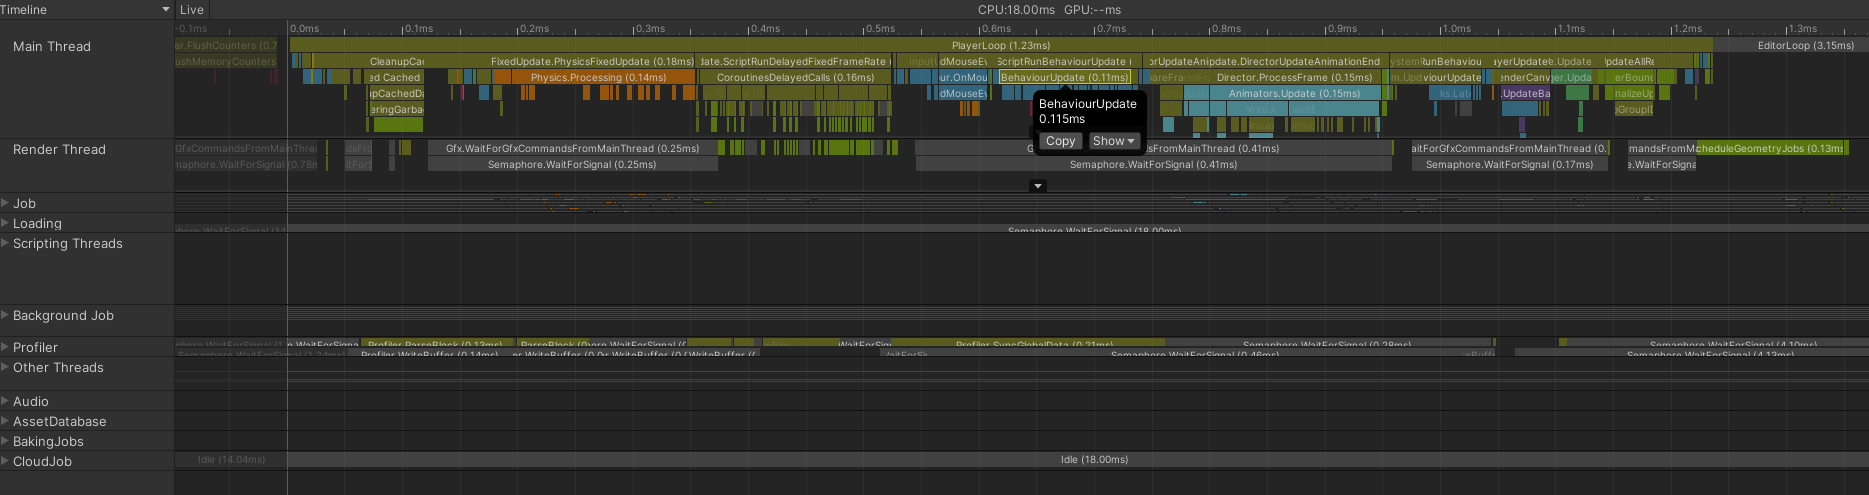
Profiler - Details window, Timeline view
- CPU usage time is easy to understand visually.
- You can inspect all threads at a glance.
- You can track timing and execution order relationships linearly.
Profiler - Details window, Hierarchy view
- Understand parent-child call relationships.
- Sort by the metric you care about.
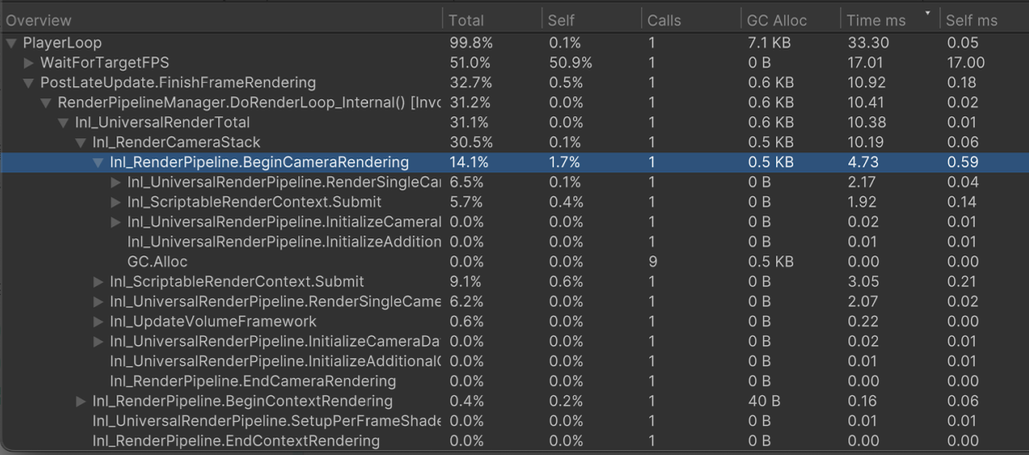
- Start by fixing the longest-running samples first.
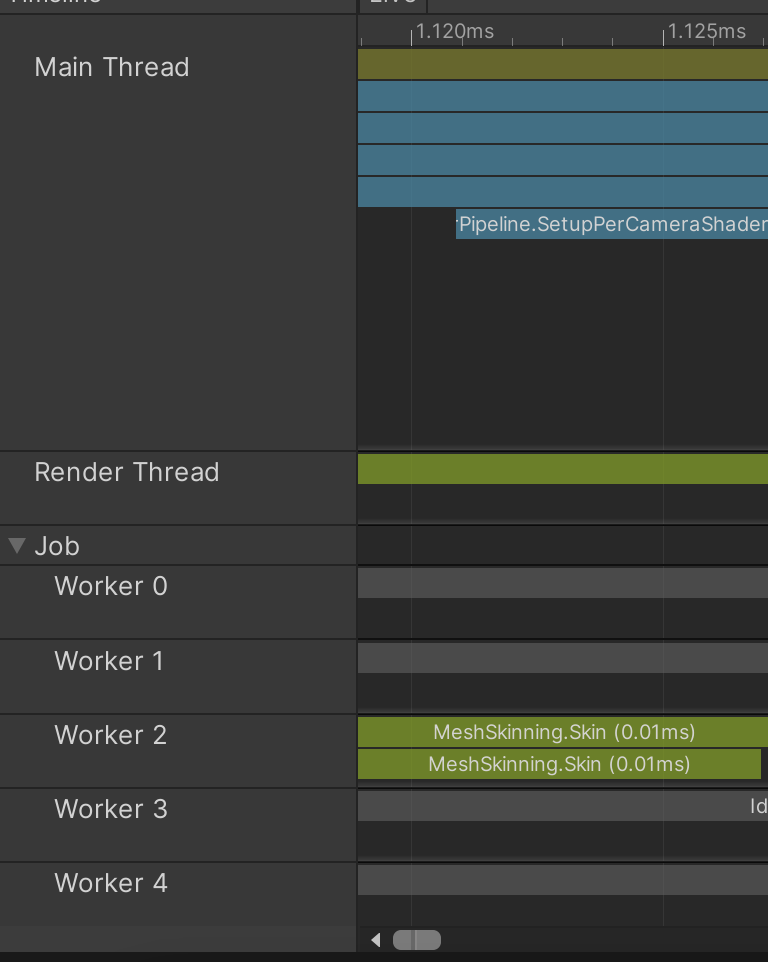
Profiler - Threads
- Main Thread
- Unity Player Loop runs (
Awake,Start, etc.) MonoBehaviourscripts primarily run here
- Unity Player Loop runs (
- Render Thread
- Thread that assembles commands to send to GPU
Draw calls are issued on Main Thread, then executed through command assembly on Render Thread
- Thread that assembles commands to send to GPU
- Worker Threads (Job Threads)
- Asynchronous parallel work from Job System, etc.
- Compute-heavy tasks such as animation/physics run here
Jobs are scheduled on Main Thread and processed on Worker Threads
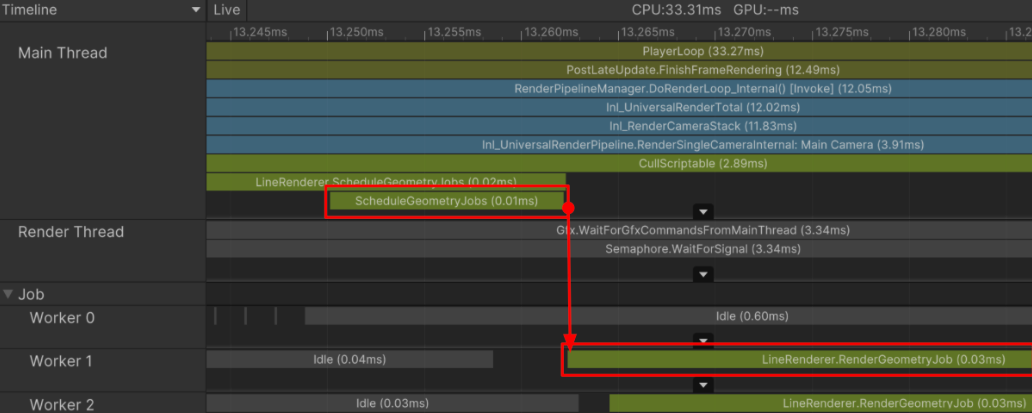
- There can be causality between methods across different threads even if they do not call each other directly.
ex1. Job scheduled > processed on worker thread
ex2. Main threadMeshRenderer.Draw()> graphics commands assembled on render thread
If main-thread work is delayed, the render thread can sit idle.
- Enable
Show Flow Eventsto inspect execution order and causality.
Sample stack vs call stack
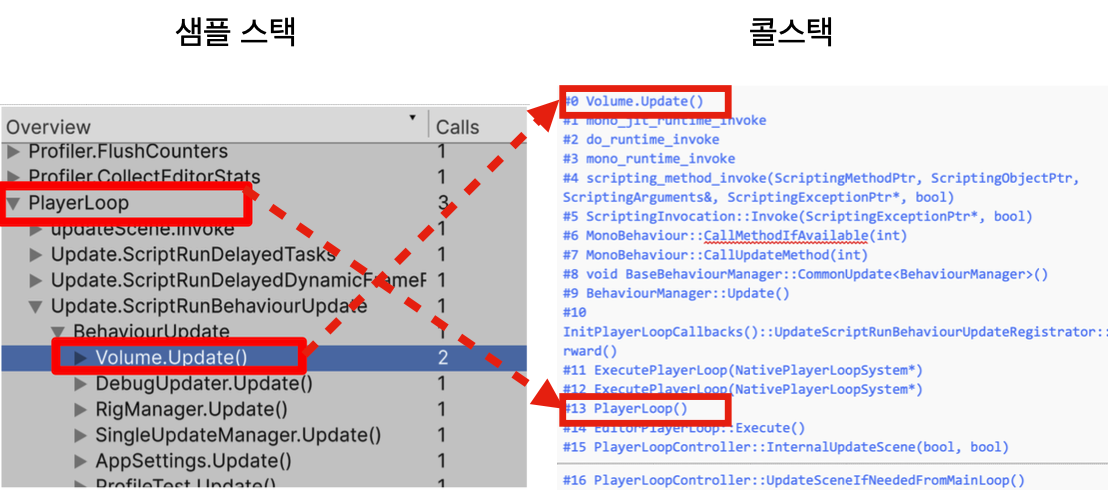
- Sample stack and call stack are different. Sample stacks are chunked and only include marked C# methods/code blocks.
- Because of that, sampling is grouped coarsely. Unity does not sample every C# method call by default; it samples marked methods/blocks.
Notes for deep profiling
In Deep Profiling, every C# call (including constructors/properties) is marked.
This introduces heavy profiling overhead and can make data less accurate.
- So deep profiling should be used only in a very limited scope and short time window.
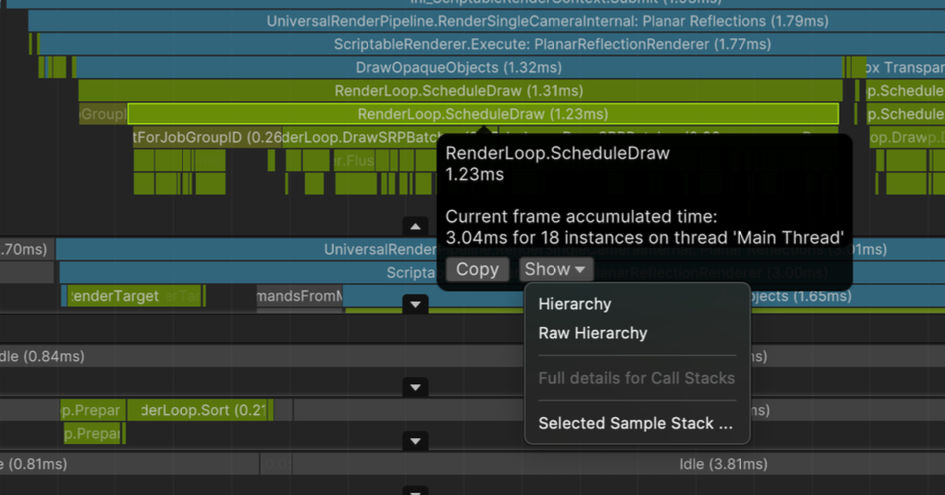
How to enable call stack
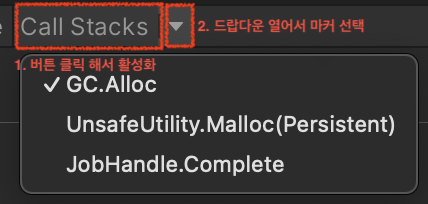
- You must enable the Call Stack button first (it becomes highlighted).
- In Call Stack dropdown, choose the marker you want.
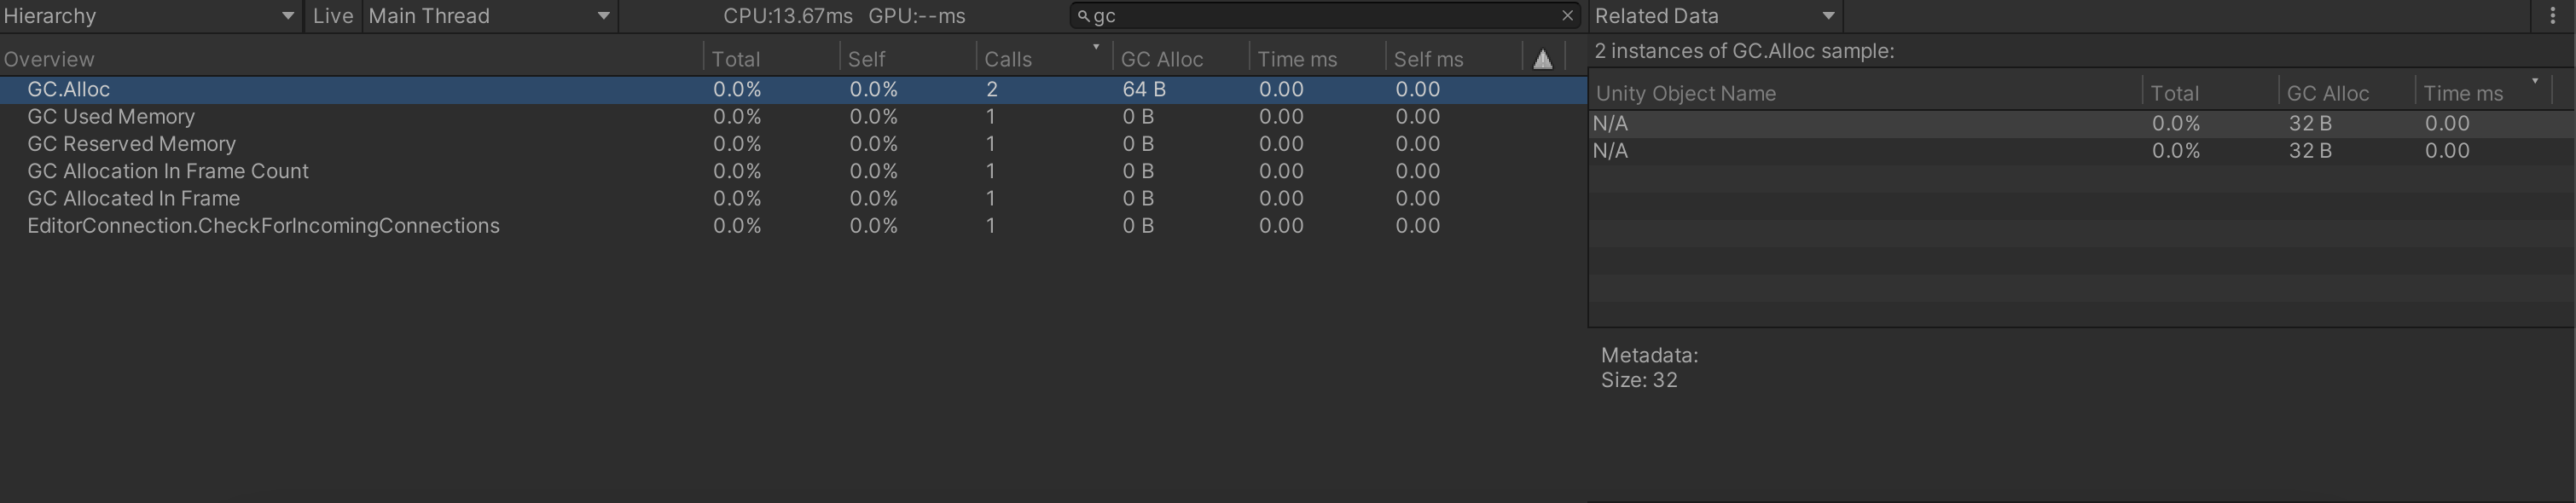
- For specific samples, you can record full call stacks.
GC.Alloc: managed allocation occurredUnsafeUtility.Malloc: unmanaged allocation that must be freed manuallyJobHandle.Complete: main thread force-synchronized job completion
- Not recommended for regular use; use only in limited cases.
About markers
1. Main loop markers
PlayerLoop: root of samples executed by player loopBehaviourUpdate: holder forUpdate()samplesFixedBehaviourUpdate: holder forFixedUpdate()samplesEditorLoop: editor-only loop
2. Graphics markers (Main Thread)
WaitForTargetFPSTime spent waiting for VSync / target framerate
Gfx.WaitForPresentOnGfxThreadMarker appears when render thread is waiting on GPU, and main thread also has to wait
Gfx.PresentFrameWaiting for GPU to render current frame
If long, GPU-side processing is slowGPU.WaitForCommandsRender thread is ready for new commands, but main thread is not feeding them yet, so it waits
Finding bottlenecks
- Graphics markers are useful for identifying CPU/GPU bounds.
- If Main Thread waits for Render Thread, bottleneck can be on thread handoff; render commands are generated around late player loop stages.
- In other words, do not only ask “GPU or CPU”; also check cross-thread bottlenecks.
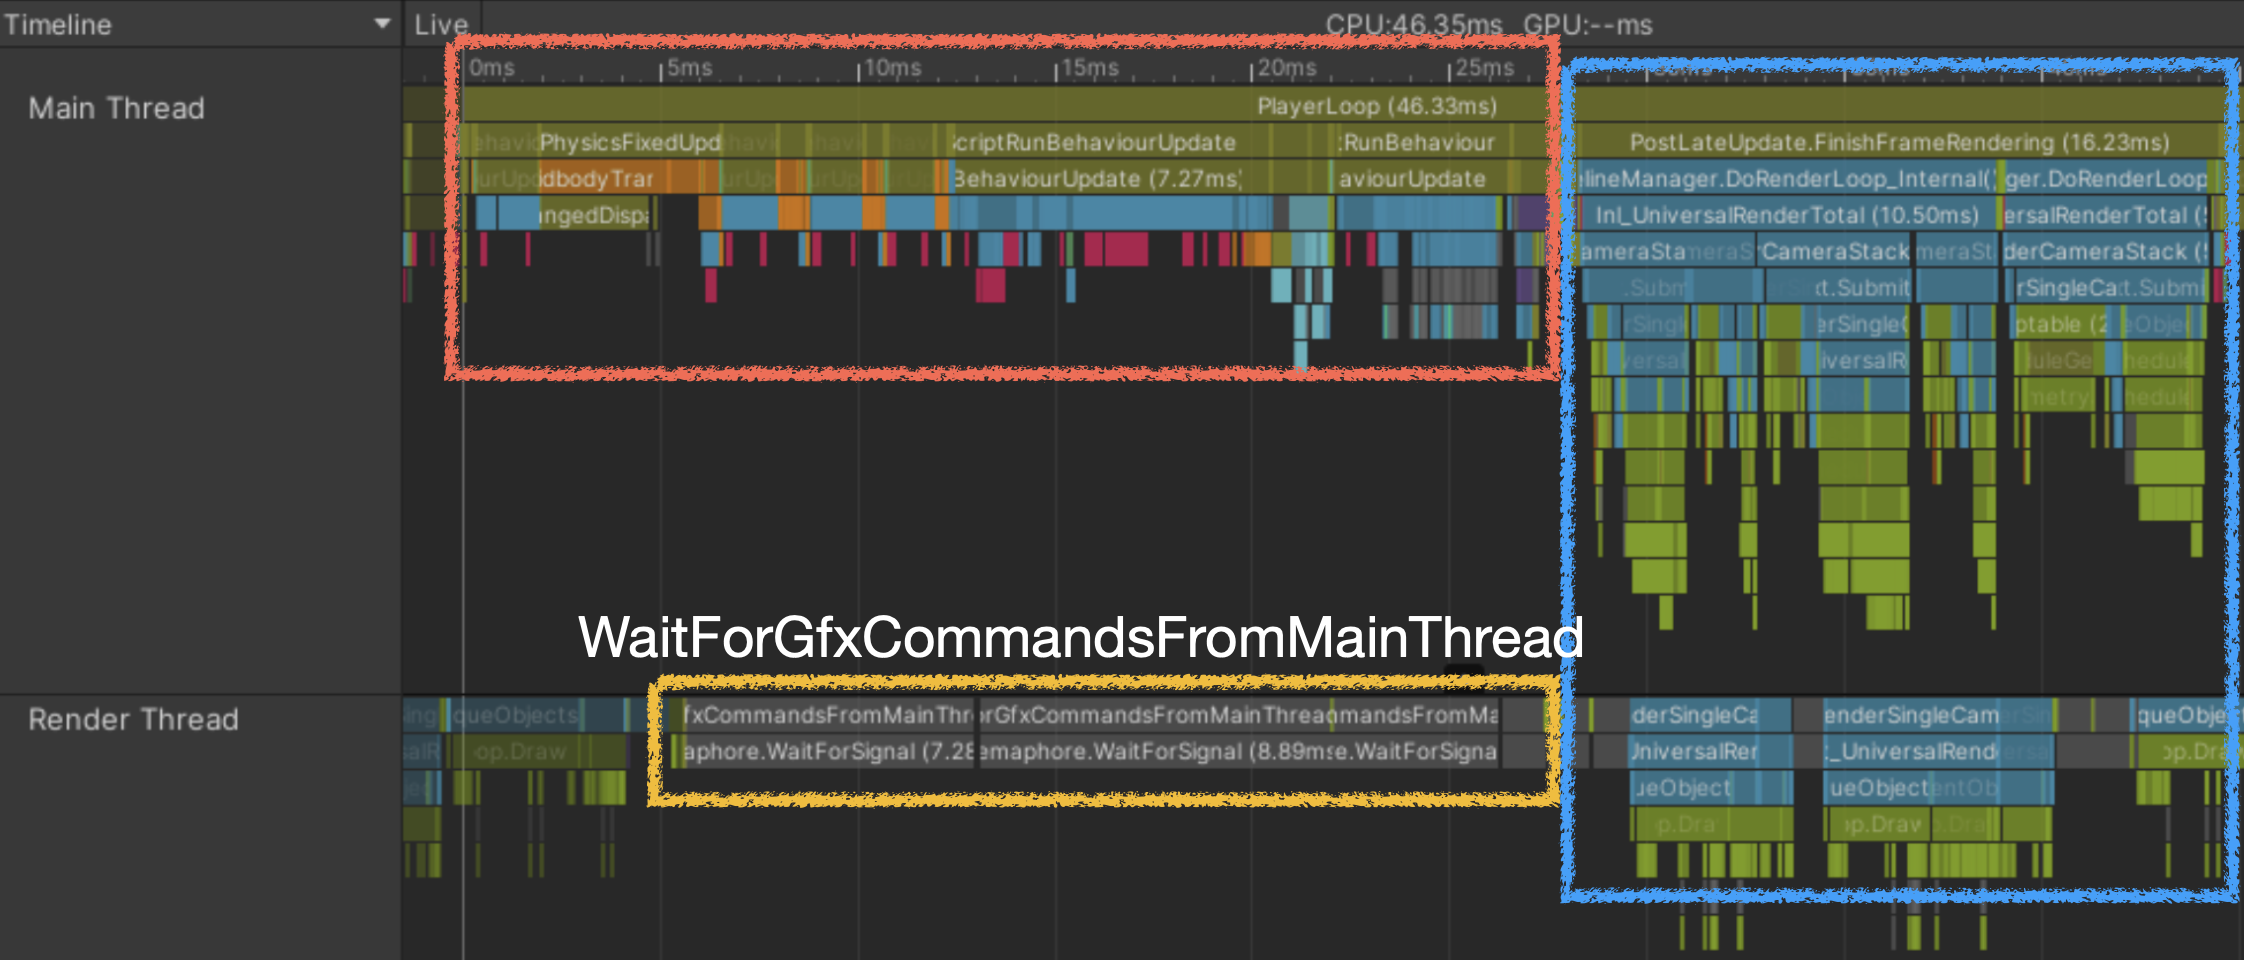
- CPU Main Thread bound
Main thread is slow, so render thread waits
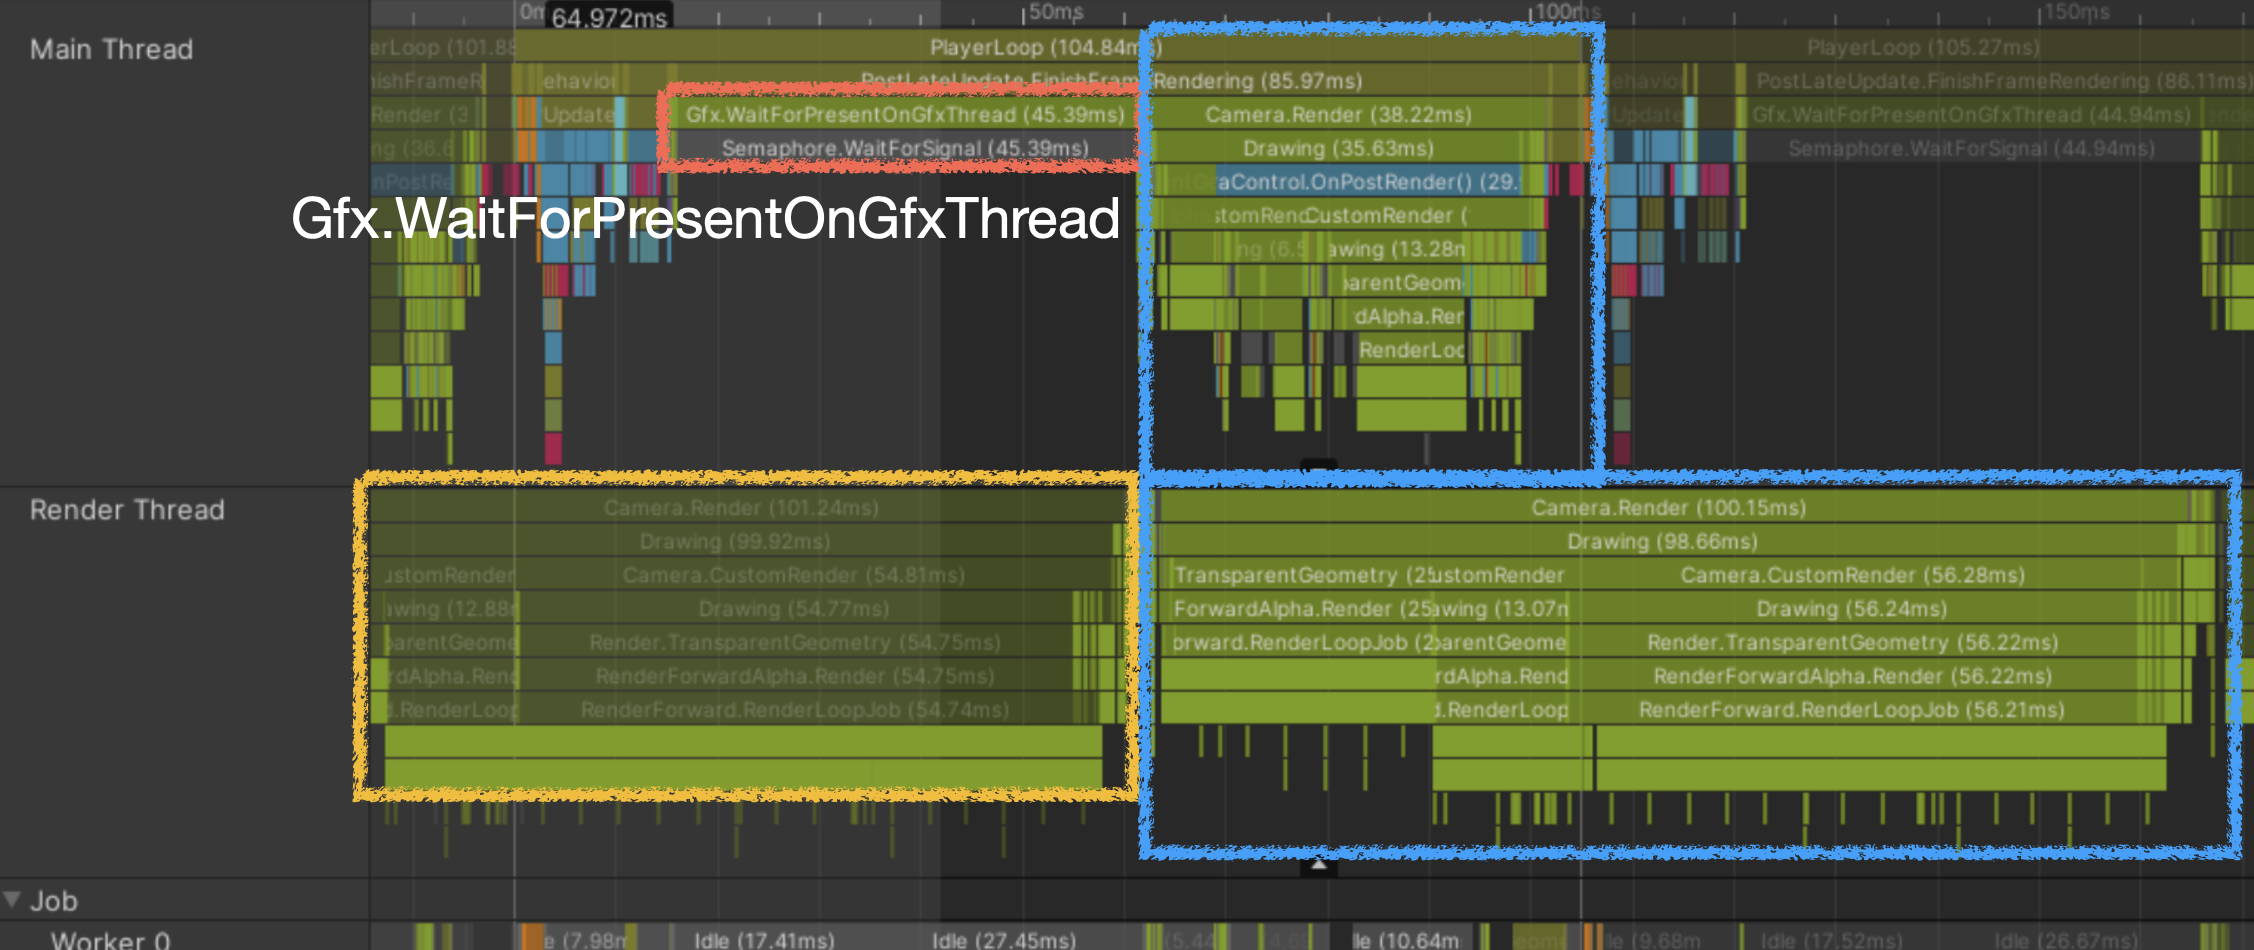
- Render Thread bound
Still sending draw-call commands for previous frame
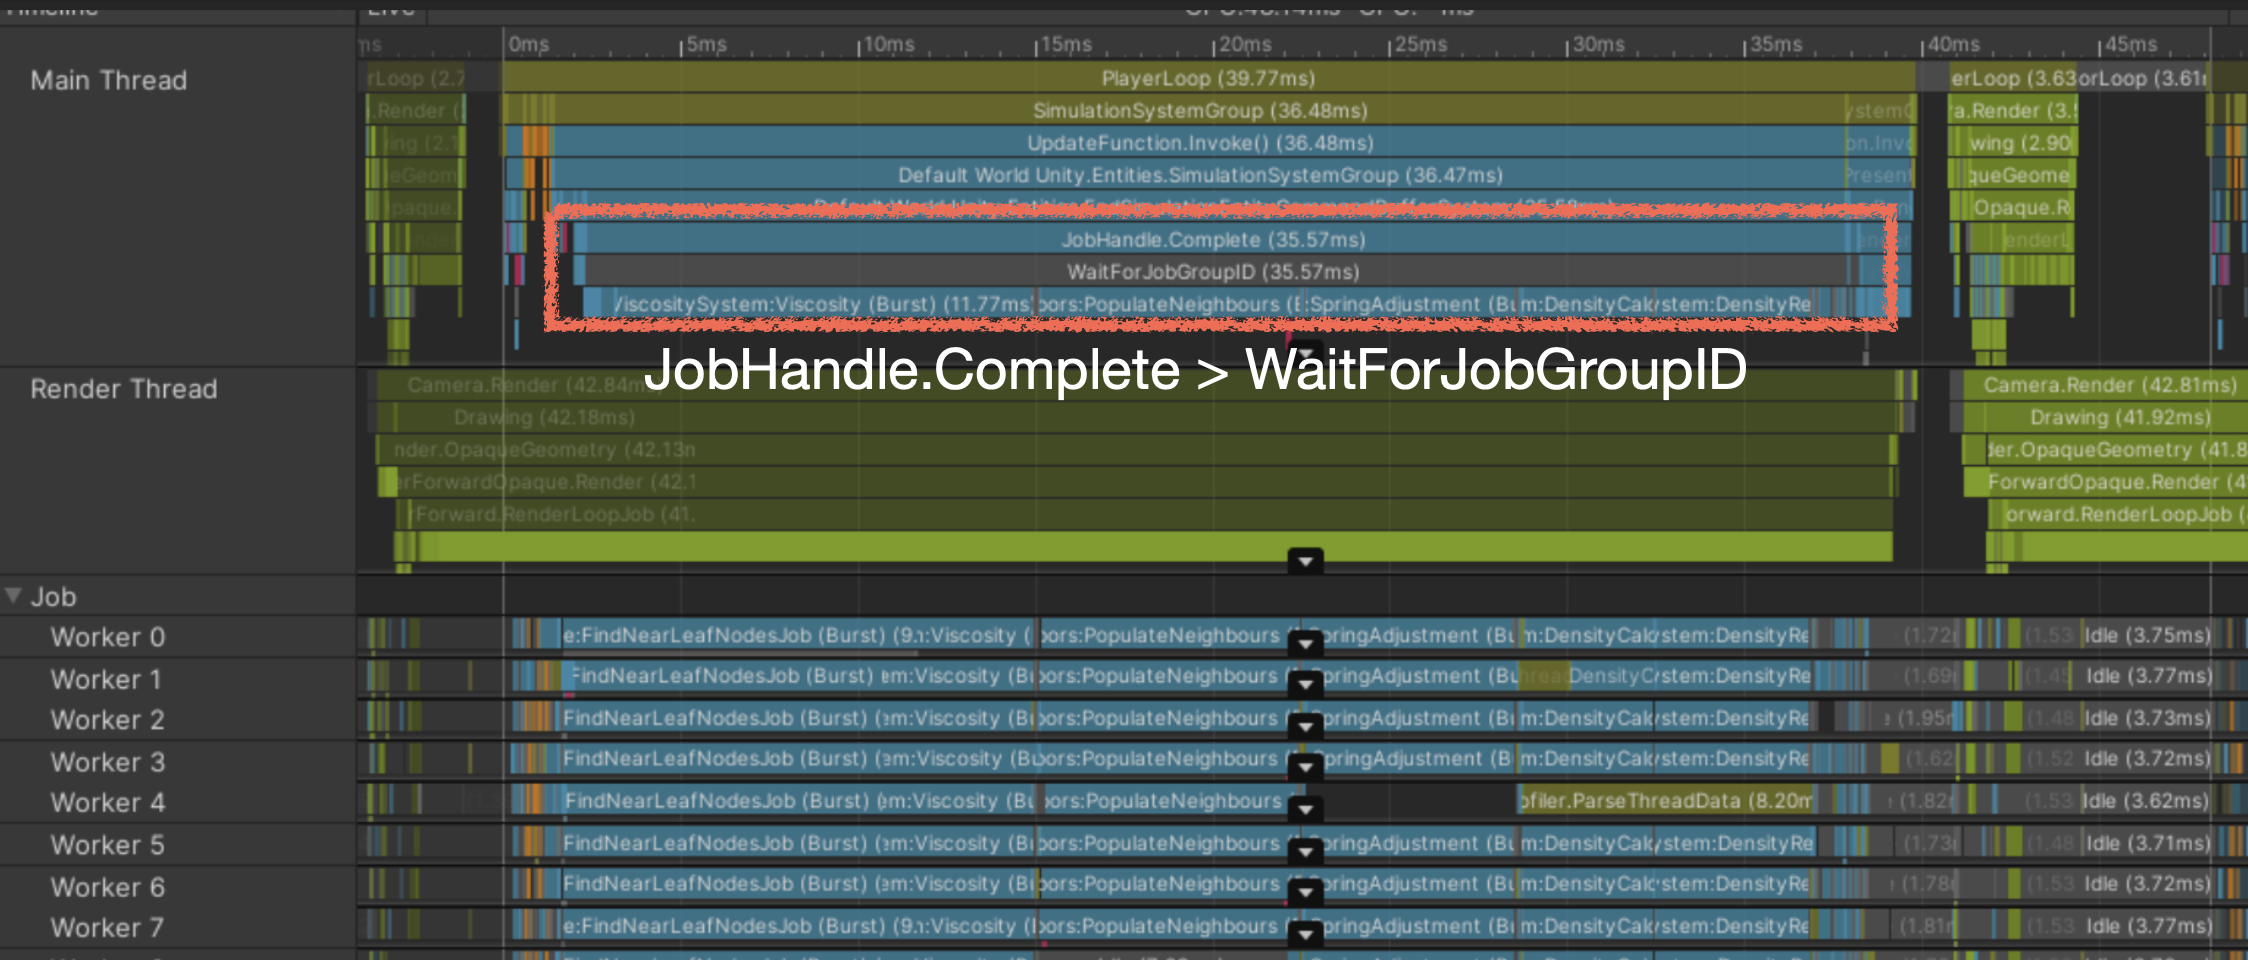
- Worker Thread bound
Main thread is synchronously waiting for jobs to complete
- Xcode Frame Debugger and newer Unity profiler versions can show CPU/GPU bound hints.
There are 4 major bottleneck types
- CPU Main Thread bound
- CPU Worker Thread bound (physics, animation, job system)
- CPU Render Thread bound (CPU-side command assembly/transfer to GPU, not GPU core bottleneck itself)
- GPU bound
- Typical bottleneck triage flow
Main thread bottleneck? Optimize player loop first
If not, focus on physics/animation/job system
If still not, inspect render-thread bottleneck and then separate GPU vs CPU factors
- If it is a render-thread CPU bottleneck
- CPU graphics optimization
Camera/culling optimization
Reduce SetPass calls (batching)
Use graphics batching where possible: SRP batching, Dynamic batching, Static batching, GPU instancing
General facts
- Before batching, one important point.
- Graphics pipeline delays can come from:
CPU-side delay while assembling commands (more common than pure GPU weakness today)
CPU->GPU command/resource upload delay
GPU internal processing delay - Draw call means CPU sends render-execute command to GPU.
In many cases, CPU cost/upload delay from render state changes is heavier than the draw call itself.
- Often the expensive part is just before “draw”.
- GPU generally prefers fewer large meshes over many tiny meshes.
- Many rendering issues are not from weak GPU compute, but from inefficient GPU usage.
Sending many tiny meshes wastes GPU execution units (Wavefront/Warp).
Example: if a unit processes 256 vertices and you keep feeding 128, utilization is wasted.
Graphics batching
1. SRP batching (URP, HDRP)
- Before draw commands, repeatedly setting different render states (different shaders) is often the bigger cost.
- Group meshes using the same shader & material
- Bundle multiple draw calls under one SetPass Call (same shader variant)
- Per-material data: upload once early in a large list
- Per-object data: upload every frame in a large list
- Select mesh from list using index/offset and call
Draw() - Reducing the number of shaders used in the project helps optimization.
2. Static batching (Static)
- GPU likes drawing large meshes at once. Concept: reduce transfer overhead.
- Pre-merge non-moving meshes and bake -> upload to GPU ahead of time -> call
DrawIndexed()per renderer - Very fast CPU/GPU processing
- Unity Editor bakes it only when building the app
- Downside: merged unique meshes increase memory usage
3. Dynamic batching (Dynamic)
- GPU likes large meshes at once. Concept: reduce transfer overhead. -> generally not highly recommended.
- Merge meshes every frame > run one
Draw() - Optimized from GPU perspective
GPU receives one mesh/draw command, so processing is very fast
- But CPU must merge meshes every frame
Fewer draw commands, but mesh-merging itself costs CPU
- Baked every frame
In some cases, merging meshes costs more than having many draw calls
4. GPU instancing
- Reduce command delivery from CPU to GPU.
- For identical mesh + identical shader/material
- Upload mesh data to GPU once
Per-instance unique data (object-to-world matrix) is sent as an array
- Very fast CPU-side when drawing many identical objects
- (<500 instances) very small-vertex meshes can be inefficient
GPU prefers large meshes; meshes with <=256 vertices often gain less.
Summary
- Typical efficiency: SRP batching, Static batching > GPU instancing > Dynamic batching
- CPU cost before draw calls, especially render state setup, is often larger than the draw call itself
- Focus on reducing SetPass calls (SRP batching) before anything else, while still optimizing draw calls as needed
- Before draw-call reductions (instancing/dynamic batching), enabling SRP batching and reducing shader variety is usually most effective
Turning on SRP batching and reducing shader kinds is often the highest impact.
Reduce SetPass calls!!
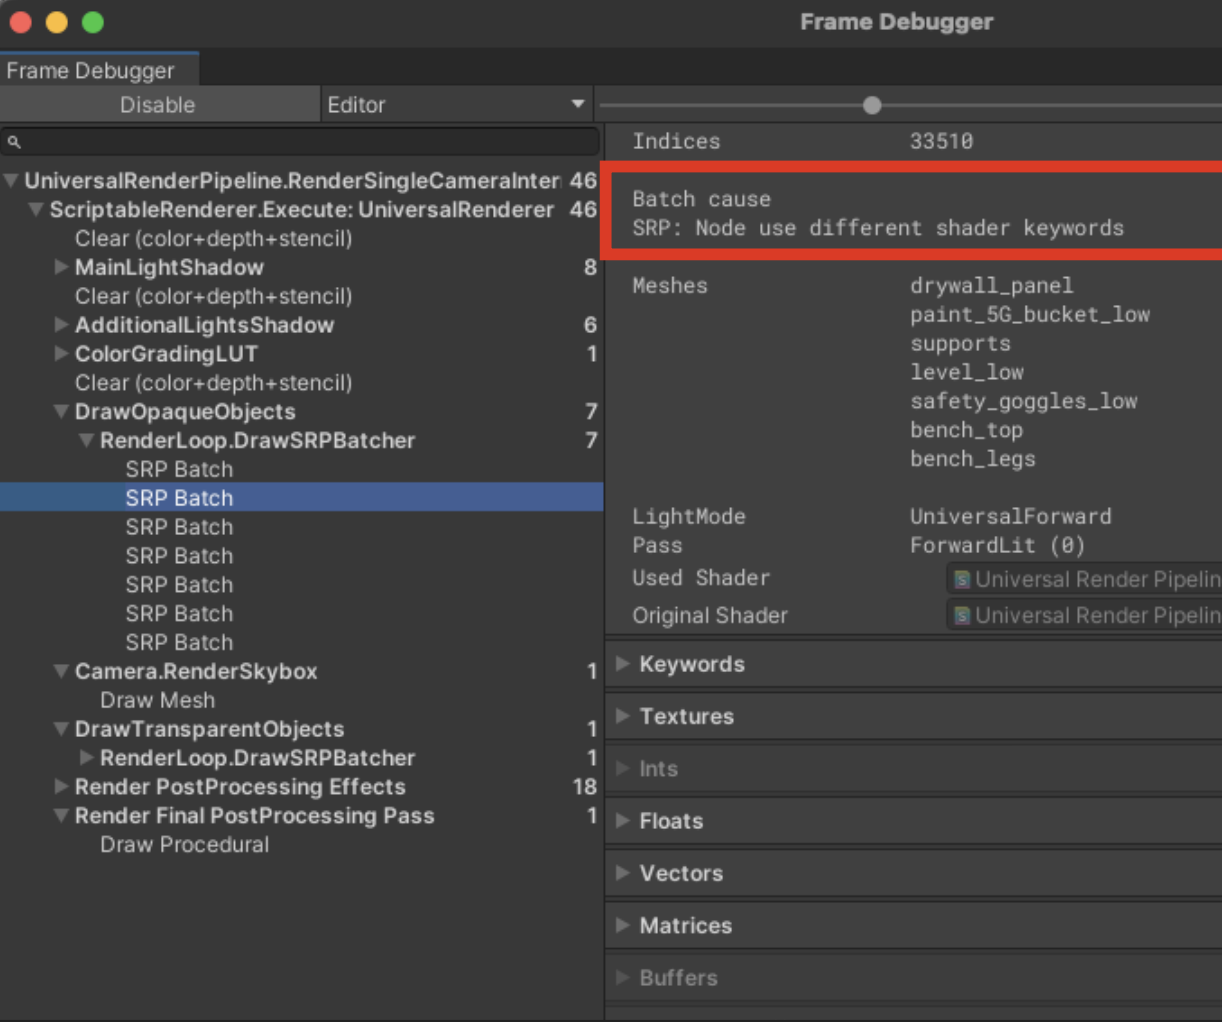
- Use Frame Debugger to see why SetPass calls are not merged.
- Set a target below 300 SetPass calls.
If GPU rendering is the bottleneck
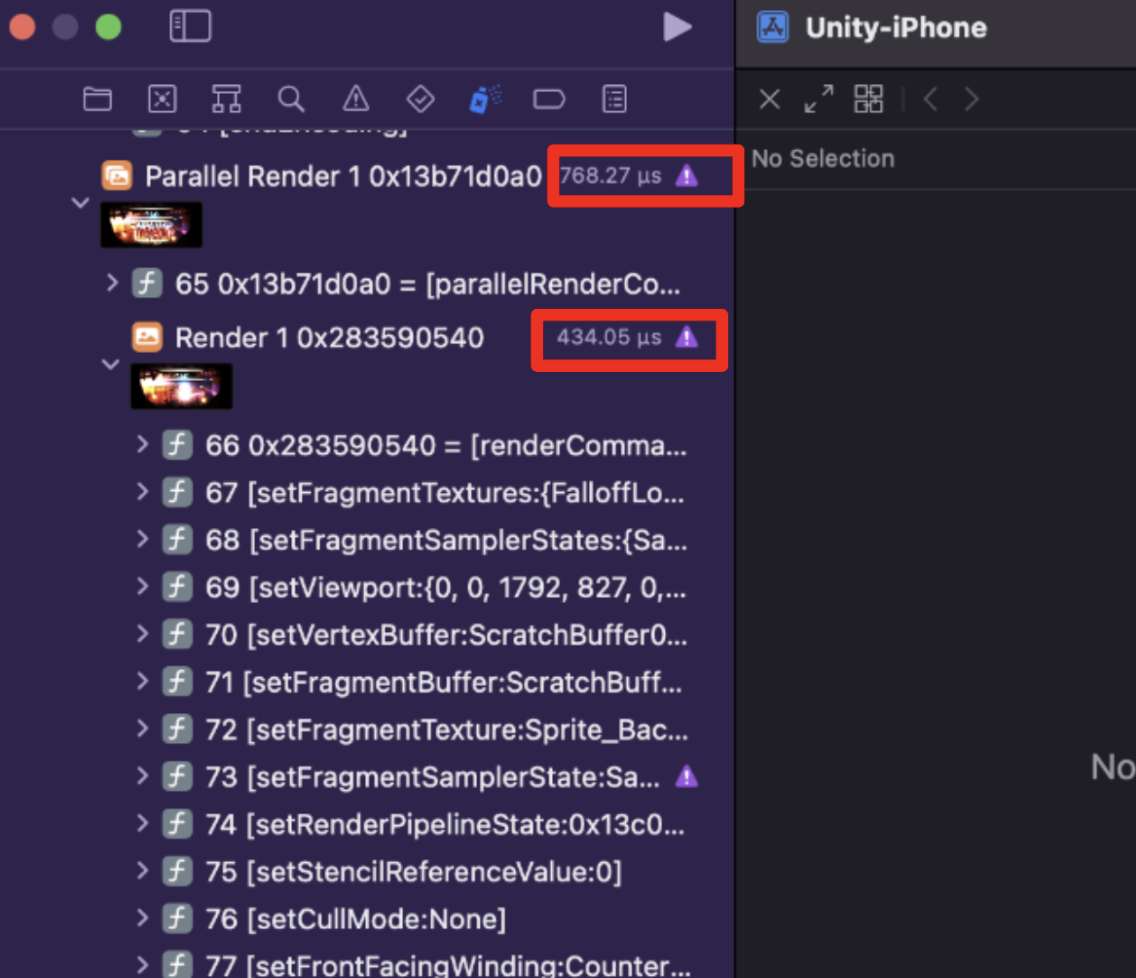
- Xcode GPU Frame Capture
- Commands are listed in sequence; inspect time cost at each render stage.
- You can find draws with abnormal cost -> find the shader/mesh used by that draw and optimize them.
- Reference
Notes from lecture by Je-min Lee (Retro Unity Partnership Engineer).
IJEMIN GitHub