
How to Check Debug Logs for iOS Apps Deployed from Mac - Instruments

How to Check Debug Logs for iOS Apps Deployed from Mac - Instruments
Mac Series (2 / 2)
- How to Install and Set Up Jekyll on Mac
- How to Check Debug Logs for iOS Apps Deployed from Mac - Instruments

Debugging a TestFlight App with macOS Instruments
During normal iOS development, we usually debug by building in this flow:
Unity project build -> Xcode project build -> install directly on a connected test phone and inspect logs.
Or we distribute via App Center/TestFlight and inspect logs with assets like SRDebugger.
But there is another way: connect an iPhone and view logs immediately through Instruments.
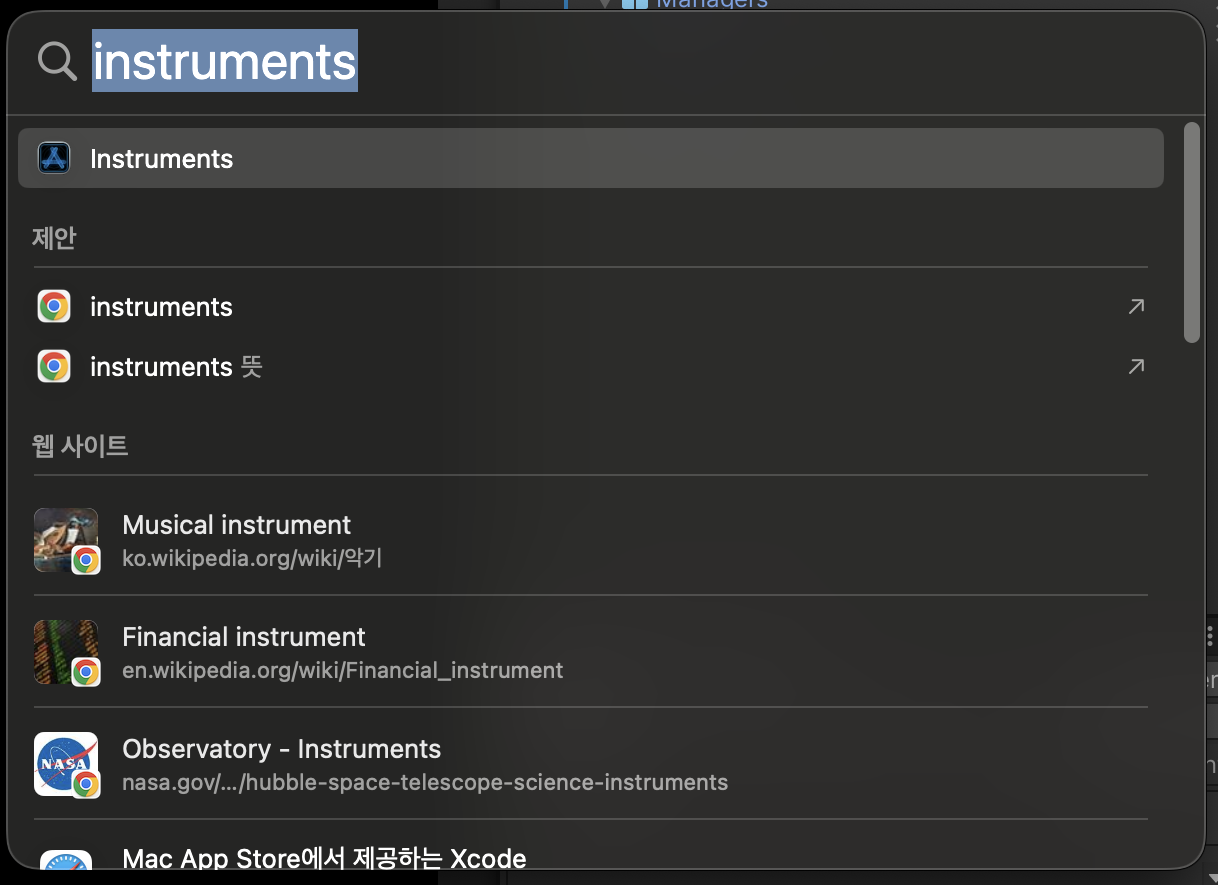
1. Press ⌘ (Command) + Space to open Spotlight search
- Search for
Instrumentsand run it.
2. Select Instruments profiling template as Blank or Logging
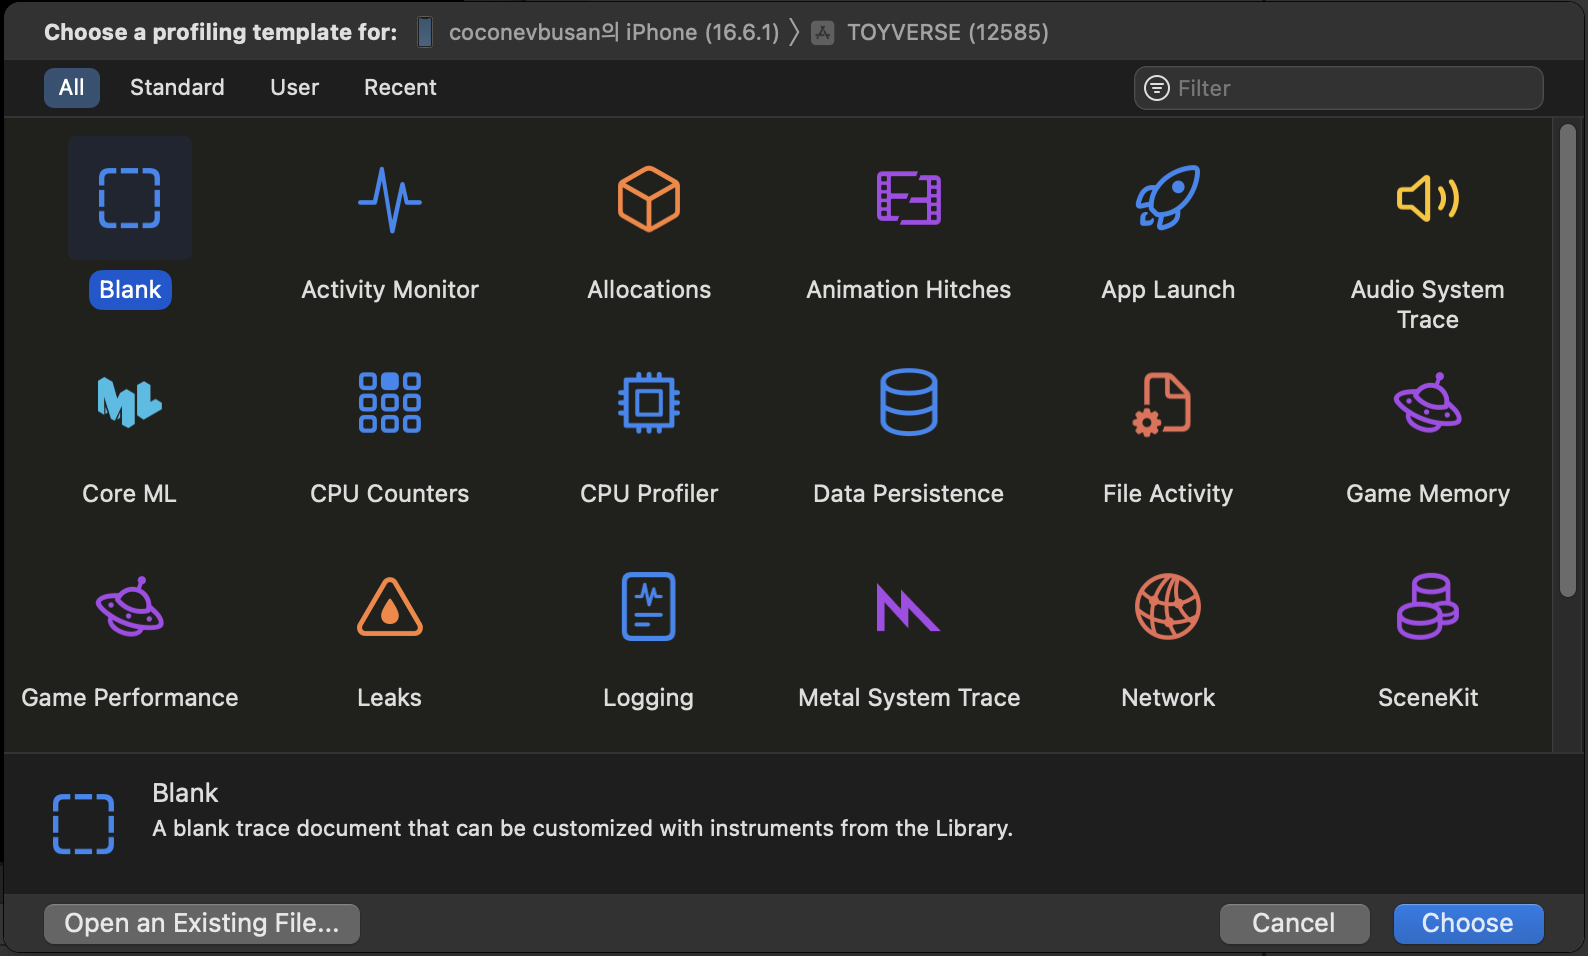
3. If you selected Blank, click the + button on the right to open filter list
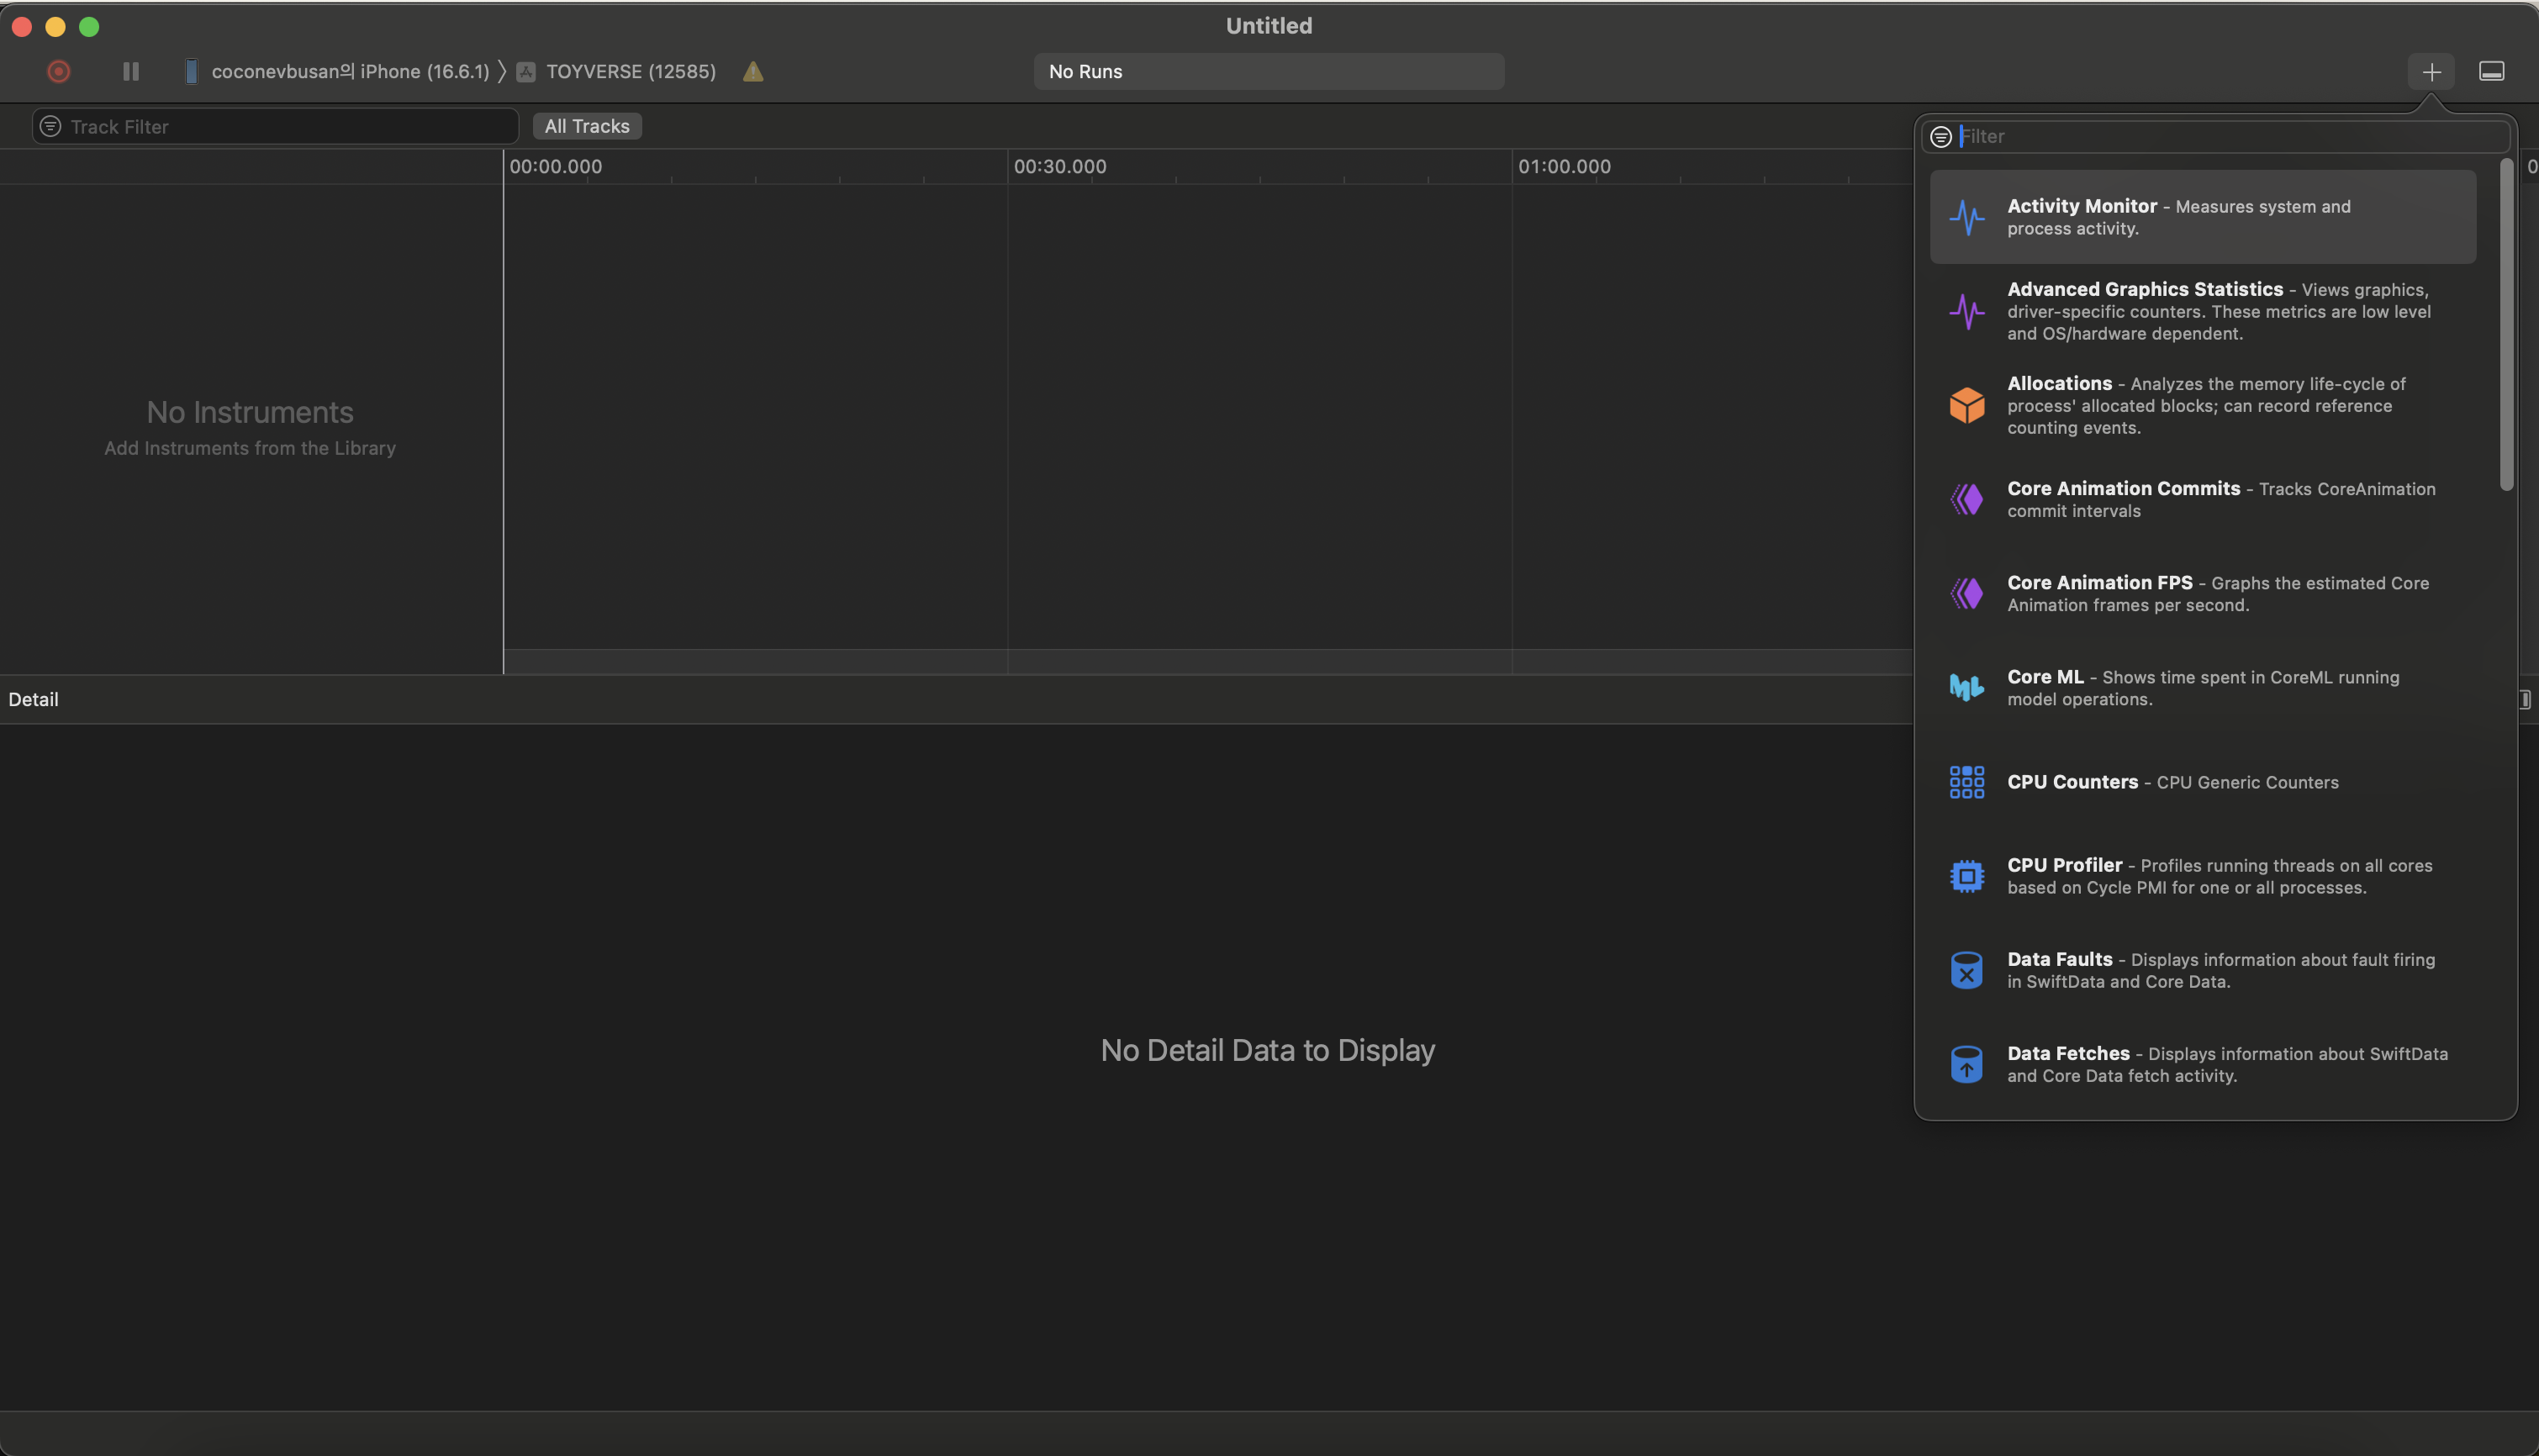
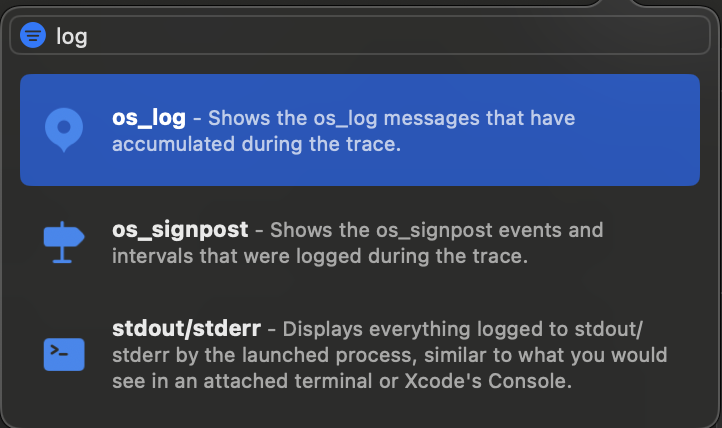
4. Type log, select os_log, and add it
5. In the top toolbar, choose the device to test -> choose the app to inspect logs
- Run the app on the test device, then click the red Record button at top-left in Instruments to start log analysis.

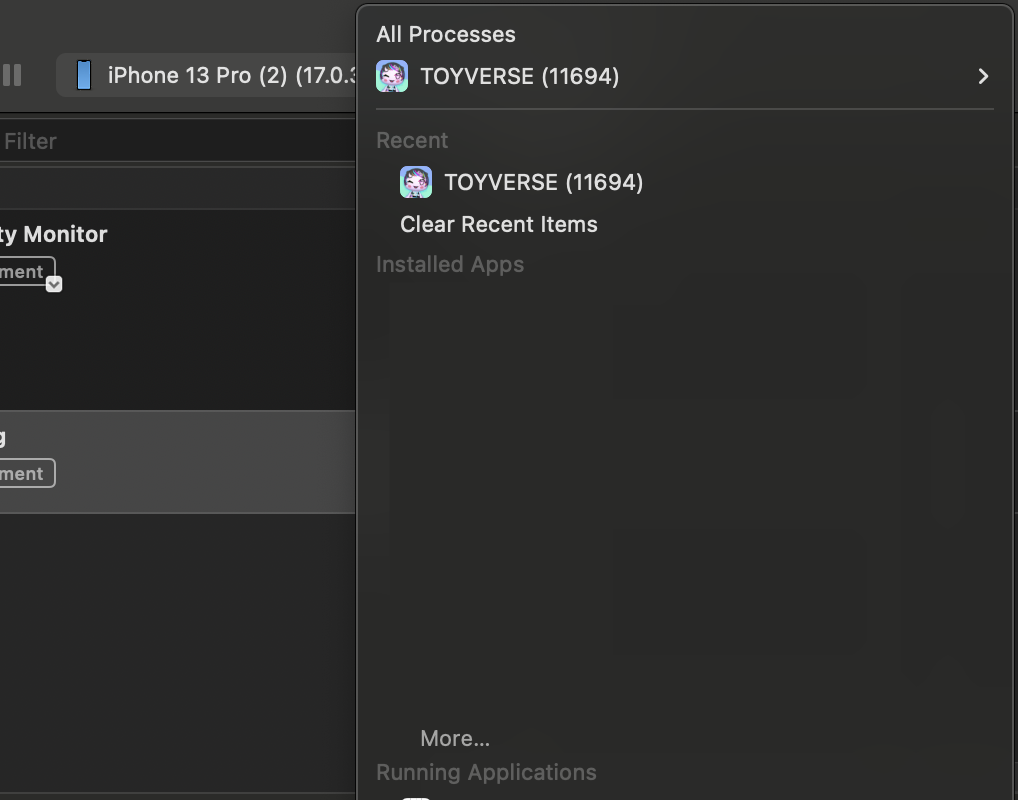
6. Expand os_log to see plugins/frameworks included in the app at the bottom
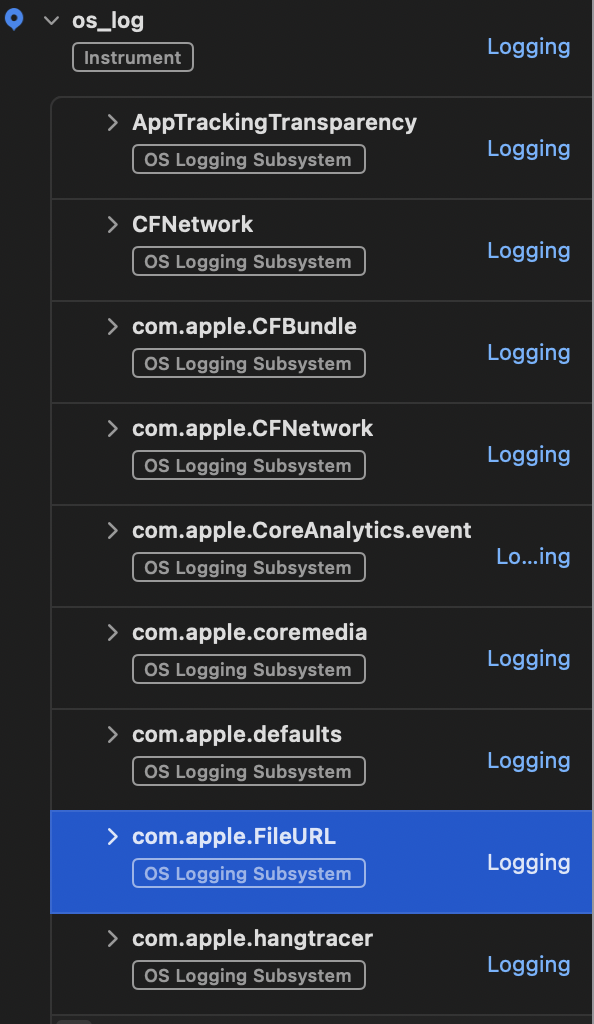
7. The part we need here is UnityFramework
- Select
UnityFramework, and logs appear in the Messages panel below.
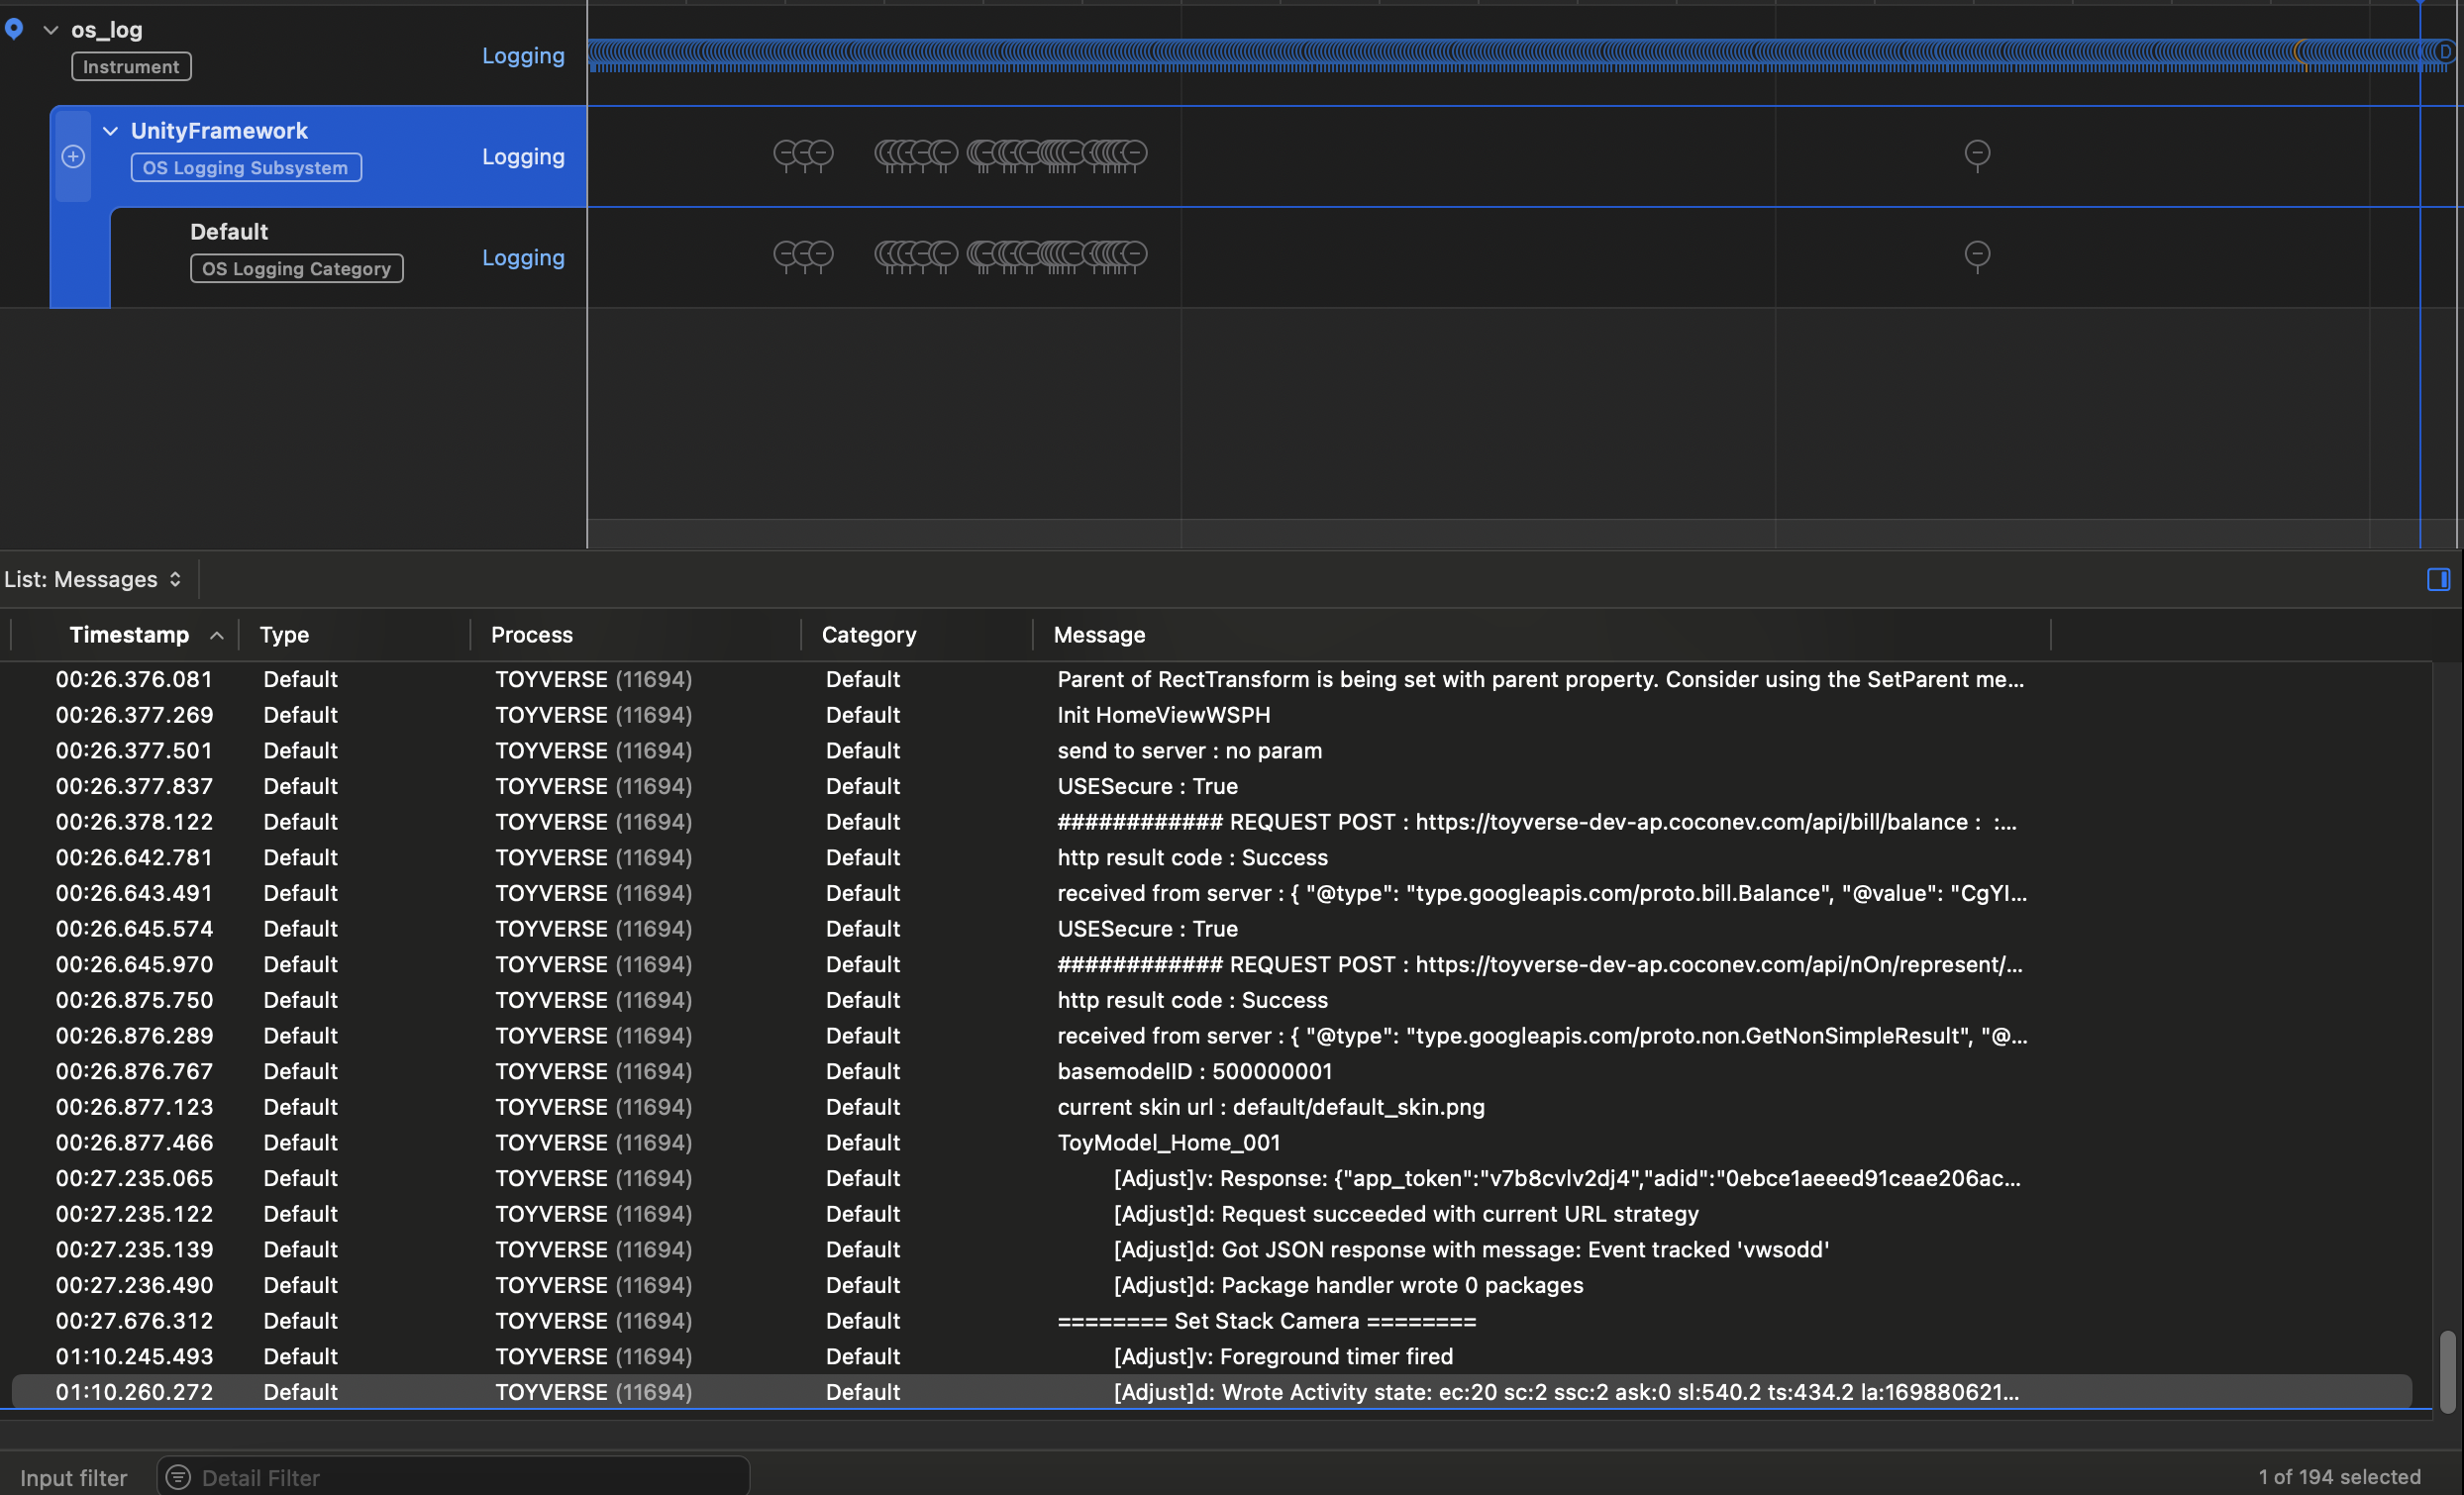
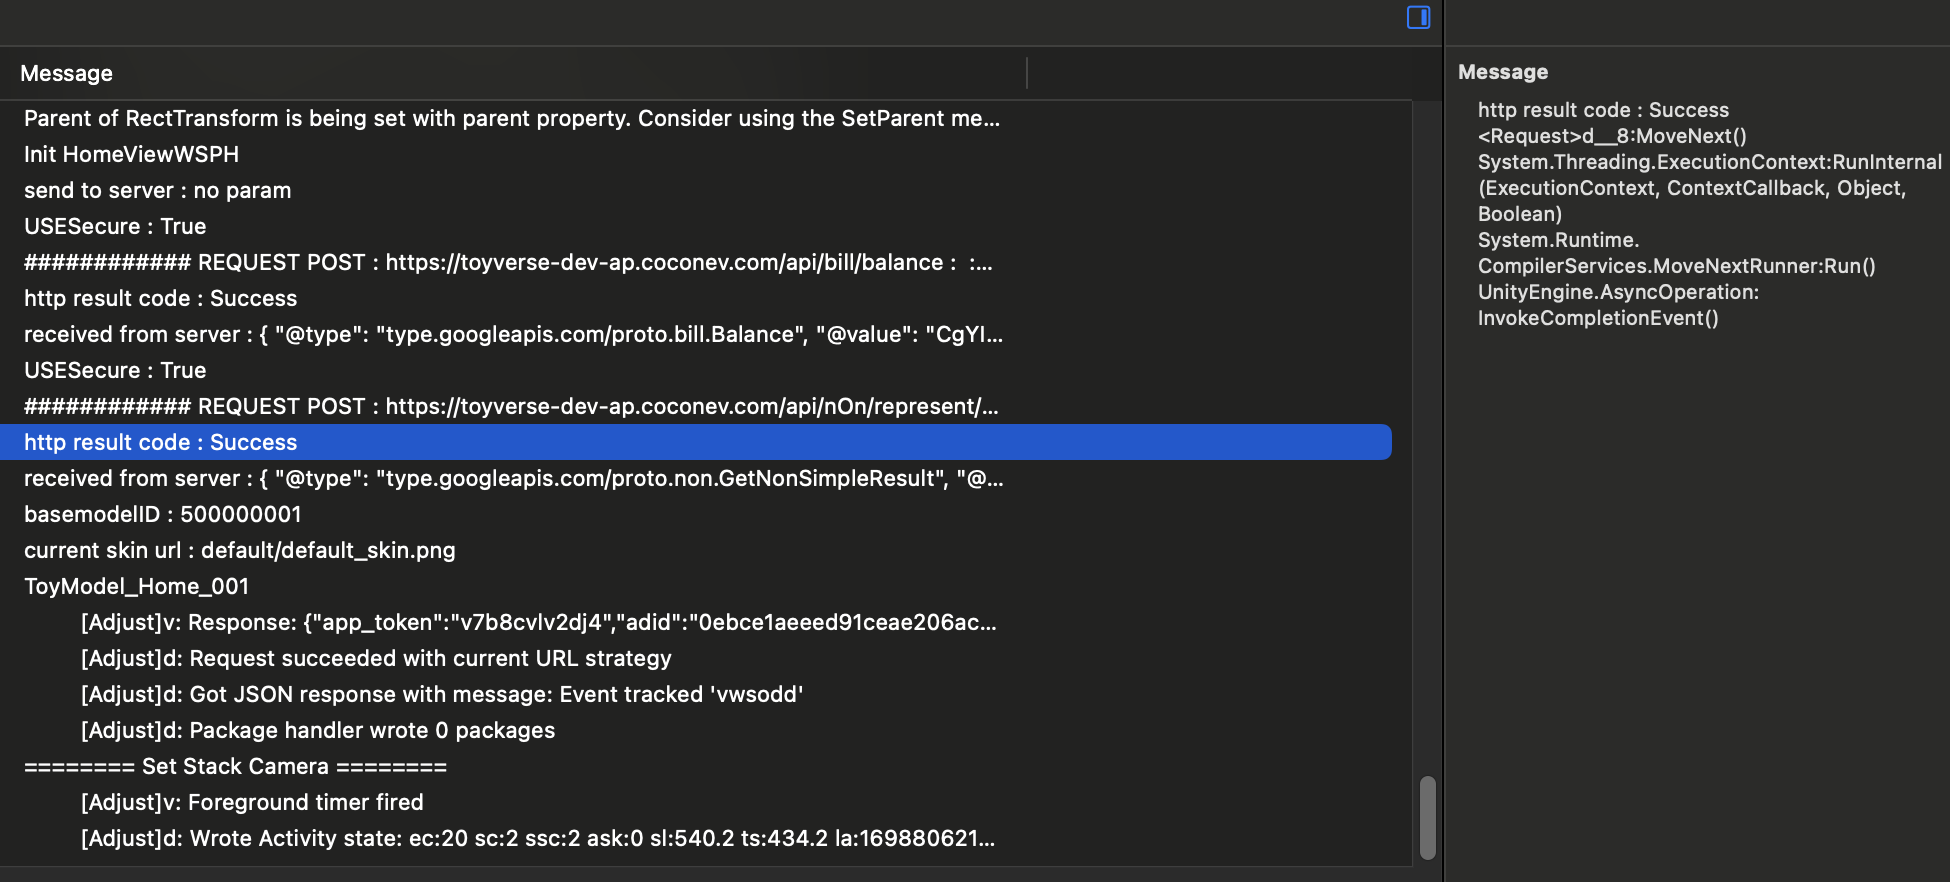
8. You cannot inspect call stacks like Editor logs, so add clear logs before testing
- You can still identify various errors through the error messages.
This post is licensed under CC BY 4.0 by the author.