
Building a Custom Unity Addressables Analyzer: The Mystery of the 38GB Ghost Duplication

- Unity Addressable System - Operating Principle and Usage
- Unity Addressable System - Update Workflow and Management
- Unity Addressable System - Internal Memory Structure and Asset Bundle Caching
- Building a Custom Unity Addressables Analyzer: The Mystery of the 38GB Ghost Duplication

I. Why a Custom Tool Was Necessary
The Pain of Manually Managing Thousands of Assets
Developing a mobile survivor-genre game, the number of assets managed via Addressables grew exponentially. Characters, monsters, skill effects, stage data, tilemaps, sounds… it became practically impossible to manually assign each asset to a group, attach labels, and specify addresses.
Specific problematic scenarios included:
- The planning team adding stage assets but forgetting to register them in Addressables, leading to runtime load failures.
- Multiple labels being attached to the same asset, causing duplicate bundle generation that went unnoticed for a long time.
- The high cost of repeatedly checking rules for “which group should this asset go into?”
Limitations of Unity’s Default Analyze Tool
Unity does provide a built-in Addressable Analyze feature. It has rules like Check Duplicate Bundle Dependencies to detect duplicate dependencies.
However, its limitations were clear for production-level use:
- Slow: Analyzing the entire project took dozens of minutes.
- Unfriendly Results: It merely listed asset paths without suggesting which group to move them to.
- Disconnected Workflow: Registration, validation, and analysis all happened in separate windows.
So, I decided to build my own.
The Actual Problem: 2,226 Duplicate Assets, 2.64GB Wasted
This was the result of running Unity’s default Analyze before building the custom tool:
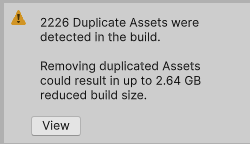 Initial analysis results: 2,226 duplicate assets, potential savings of up to 2.64GB.
Digging deeper revealed three core issues:
1. Direct References to Naninovel BGM (Human Error)
Stage data was directly referencing sounds in the Naninovel/Audio/BGM/ path. Because of this, BGMs from the Naninovel bundle (6.29MB + 6.60MB) were being implicitly copied into over 100 stage bundles, wasting hundreds of MBs.
1
2
3
4
5
Problematic Structure:
StageData_Area001 Bundle → BGM_Battle_01.wav (Implicit Copy) ─┐
StageData_Area002 Bundle → BGM_Battle_01.wav (Implicit Copy) ─┼→ Same file duplicated
StageData_Area003 Bundle → BGM_Battle_01.wav (Implicit Copy) ─┘   in 100+ bundles!
... (Over 100 stage bundles)
2. The Trap of the ‘Pack Separately’ Strategy
Packing each stage into an individual bundle is good for independent loading/unloading, but shared assets (materials, shaders, textures) end up being duplicated in every bundle. Sprite-Unlit-Default and common tile textures were being copied hundreds of times.
3. Absence of Registration Rules
There were no clear rules on where to register which assets, so every developer placed them differently. Duplicate dependency issues were difficult to catch during code reviews.
II. Tool Architecture Design
Overall Structure
graph TB
    subgraph UI["Main UI (AddressablesIntegratedWindow)"]
        Sidebar["Sidebar<br/>Group List + D&D"]
        Toolbar["Toolbar<br/>Search, Stats, L10n"]
        Content["Content<br/>Asset Card Rendering"]
    end

    subgraph Analysis["Analysis Module"]
        DupAnalyzer["DuplicationAnalyzer<br/>Duplicate Analysis"]
        BuildReport["BuildReportAnalyzer<br/>Build Report"]
        DepPopup["DependencyAnalysisPopup<br/>Dependency Details"]
    end

    subgraph Validation["Validation Module (Strategy Pattern)"]
        RuleValidator["RuleValidator<br/>Orchestrator"]
        Registry["DetectorRegistry<br/>Auto Discovery"]
        Tile["TileDetector<br/>P:100"]
        Sound["SoundDetector<br/>P:90"]
        Char["CharacterDetector<br/>P:80"]
        Stage["StageDetector<br/>P:70"]
        Monster["MonsterSkillDetector<br/>P:60"]
        Misc["MiscDetector<br/>P:0"]
    end

    subgraph Utils["Utilities"]
        Cache["AnalysisCache<br/>Analysis Result Caching"]
        Git["GitHelper<br/>Changed Asset Detection"]
        L10n["Localization<br/>EN/JP/KO"]
    end

    UI --> Analysis
    UI --> Validation
    UI --> Utils
    RuleValidator --> Registry
    Registry --> Tile & Sound & Char & Stage & Monster & Misc
    DupAnalyzer --> Cache
The editor tool was divided into 7 modules:
| Module | Role | Key Files |
|---|---|---|
| Core | Main UI Window | AddressablesWindow.cs (Partial Class) |
| Analyzers | Duplication/Dependency/Build Analysis | DuplicationAnalyzer.cs |
| Validators | Automatic Asset Type Detection | IAssetTypeDetector + 6 Implementations |
| Tiles | Tile-specific Tools | TileLabelManager.cs and 7 others |
| Specialized | Domain-specific Tools | Audio separation, preloading, etc. |
| Utilities | Shared Features | Caching, Git integration, Localization |
| Legacy | Legacy Compatibility | Previous bulk registration wizard |
Automatic Asset Type Detection via Strategy Pattern
The most critical design decision was applying the Strategy Pattern to asset type detection.
A game has various asset types, each with different registration rules:
- Tile assets must have an “Area” label.
- Sounds must be categorized into BGM/SE/VOICE.
- Character prefabs and portraits go into different groups.
- Child dependencies of monster skills (_Bullet, _Effect) should not be registered.
Implementing this with if/else would make maintenance impossible. Instead, I defined an interface:
1
2
3
4
5
6
7
8
9
10
11
12
13
14
15
16
17
public interface IAssetTypeDetector
{
    /// <summary>
    /// Priority. Higher values are checked first.
    /// </summary>
    int Priority { get; }

    /// <summary>
    /// Checks if this detector can handle the given asset.
    /// </summary>
    bool CanHandle(string assetPath);

    /// <summary>
    /// Detects registration info (group, label, address) for the asset.
    /// </summary>
    AssetRegistrationInfo Detect(string assetPath);
}
Then, I configured a chain of 6 Detectors by priority:
| Detector | Priority | Target |
|---|---|---|
TileAssetDetector | 100 | Tile assets (.asset in TileMap/) |
SoundAssetDetector | 90 | Audio files (BGM, SE, VOICE) |
CharacterAssetDetector | 80 | Character prefabs, portraits |
StageAssetDetector | 70 | Stage data, maps |
MonsterSkillDetector | 60 | Monster/Skill prefabs |
MiscAssetDetector | 0 | Events, Backgrounds, Video (Fallback) |
The key: When a new asset type is added, you only need to create one Detector class. The DetectorRegistry uses reflection for auto-discovery, so existing code doesn’t need to be modified:
1
2
3
4
5
6
7
8
9
10
11
12
13
14
15
16
17
18
19
20
21
22
public static class DetectorRegistry
{
    private static List<IAssetTypeDetector> cachedDetectors;

    public static IReadOnlyList<IAssetTypeDetector> GetDetectors()
    {
        if (cachedDetectors == null)
            cachedDetectors = DiscoverDetectors();
        return cachedDetectors;
    }

    private static List<IAssetTypeDetector> DiscoverDetectors()
    {
        var detectorType = typeof(IAssetTypeDetector);
        return Assembly.GetExecutingAssembly().GetTypes()
            .Where(t => detectorType.IsAssignableFrom(t) && !t.IsInterface && !t.IsAbstract)
            .Select(t => Activator.CreateInstance(t) as IAssetTypeDetector)
            .Where(d => d != null)
            .OrderByDescending(d => d.Priority)
            .ToList();
    }
}
This structure strictly adheres to the Open/Closed Principle: open for extension, closed for modification.
Managing a Massive Editor Window with Partial Classes
Because the main UI, AddressablesIntegratedWindow, has many features, the code was bound to be extensive. To keep it readable, I split it into Partial Classes:
1
2
3
4
5
6
7
8
AddressablesWindow.cs          // Core: OnGUI, Lifecycle
AddressablesWindow.Sidebar.cs  // Sidebar rendering
AddressablesWindow.Toolbar.cs  // Toolbar rendering
AddressablesWindow.Content.cs  // Asset card rendering
AddressablesWindow.DragDrop.cs // Drag and Drop
AddressablesWindow.Data.cs     // Data loading/filtering
AddressablesWindow.Validation.cs // Validation logic
AddressablesWindow.Registration.cs // Registration logic
Each file has a single responsibility while still accessing members of the same class, allowing for independent management of features.
III. The 38GB Ghost Duplication Case
The Incident: 38GB in Analysis… But Only 3-4GB in Actual Bundles?
When I first ran the tool’s analysis feature, a shocking number appeared.
Estimated Duplication Size: 38.13 GB
The total size of the actual built bundles is about 3-4GB, so how could there be 38GB of duplication? Clearly, something was wrong.
Checking the exported CSV revealed the cause. Take the analysis result for tile_base_001.png, for example:
1
2
3
4
tile_base_001.png:
  - ReferenceCount: 413
  - Size: 1,824,570 bytes (1.74MB)
  - SuggestedGroup: StageShared
The estimated wasted size for this one texture was: 1.74MB x (413 - 1) = ~717MB
717MB of duplication for one file? With hundreds of such files, it added up to 38GB.
The Cause: ReferenceCount vs. BundleCount
The core of the problem was confusing the “number of assets” with the “number of bundles.”
Our project uses the Pack Together By Label mode for the StageData group. In this mode, all assets with the same label are packed into one bundle.
graph LR
    subgraph WRONG["Wrong Calculation (ReferenceCount)"]
        A1["StageData_001.asset"] -->|Ref| T1["tile_base_001.png"]
        A2["StageData_002.asset"] -->|Ref| T1
        A3["..."] -->|Ref| T1
        A413["StageData_413.asset"] -->|Ref| T1
    end

    subgraph RIGHT["Correct Calculation (BundleCount)"]
        B1["Bundle: Area001<br/>(200 StageData)"] -->|Includes| T2["tile_base_001.png"]
        B2["Bundle: Area002<br/>(213 StageData)"] -->|Includes| T2
    end
Wrong Calculation:
\[ext{Duplication Size} = ext{Size} imes ( ext{ReferenceCount} - 1) = 1.74 ext{MB} imes 412 = 717 ext{MB}\]Correct Calculation:
\[ext{Duplication Size} = ext{Size} imes ( ext{BundleCount} - 1) = 1.74 ext{MB} imes (2 - 1) = 1.74 ext{MB}\]While 413 assets reference it, in “Pack Together By Label” mode, these assets only end up in 2 bundles (Area001, Area002). The actual duplication is 1.74MB, not 717MB. It was an overestimation of about 412 times.
The Fix: Calculation Based on BundleCount
The key fix was adding bundle-level tracking to ImplicitDependencyInfo:
1
2
3
4
5
6
7
8
9
10
11
12
13
14
15
16
17
18
19
20
public class ImplicitDependencyInfo
{
    public string DependencyPath;
    public long Size;
    public List<string> ReferencedBy = new List<string>();

    /// <summary>
    /// List of unique bundles containing this dependency.
    /// In "Pack Together By Label" groups, one bundle per label.
    /// </summary>
    public HashSet<string> ReferencingBundles = new HashSet<string>();

    /// <summary>
    /// Actual number of duplicate bundles. Use this for duplication calculations.
    /// BundleCount is a more accurate metric than ReferenceCount.
    /// </summary>
    public int BundleCount => ReferencingBundles.Count > 0
        ? ReferencingBundles.Count
        : ReferencedBy.Count;
}
I modified the analysis logic to track bundle IDs:
1
2
3
4
5
6
7
8
9
10
11
12
13
14
15
16
17
18
19
// Determine bundle identifier
var bundleIds = new List<string>();
if (isPackByLabelGroup && entry.labels.Count > 0)
{
    // Pack By Label: One label = One bundle
    foreach (var label in entry.labels)
        bundleIds.Add($"{group.Name}:{label}");
}
else
{
    // Other modes: Bundle per asset
    bundleIds.Add($"{group.Name}:{entry.address}");
}

// Record referencing bundles for each dependency
foreach (var bundleId in bundleIds)
{
    depInfo.ReferencingBundles.Add(bundleId);  // Automatically deduplicated by HashSet
}
And updated the total duplication size calculation to use BundleCount:
1
2
3
4
5
6
7
8
9
10
11
12
13
14
15
16
17
18
public long GetEstimatedImplicitDependencySize(bool useCompressionEstimate = true)
{
    long total = 0;
    foreach (var dep in implicitDependencies)
    {
        long effectiveSize = dep.Size;

        if (useCompressionEstimate)
        {
            float compressionRatio = GetEstimatedCompressionRatio(dep.DependencyPath);
            effectiveSize = (long)(dep.Size * compressionRatio);
        }

        // Duplication calculation based on BundleCount
        total += effectiveSize * (dep.BundleCount - 1);
    }
    return total;
}
Estimating Compression: Source Size vs. Bundle Size
Correcting BundleCount reduced the figure from 38GB to a few hundred MBs, but it was still higher than reality. This is because the source file size and the actual size in the bundle differ.
A 3MB PNG texture becomes about 450KB in a bundle after ASTC/ETC2 platform compression and LZMA bundle compression.
I introduced compression ratio estimates per asset type:
1
2
3
4
5
6
7
8
9
10
11
12
13
14
15
16
17
18
19
20
21
22
23
24
25
private static float GetEstimatedCompressionRatio(string assetPath)
{
    string ext = Path.GetExtension(assetPath).ToLowerInvariant();

    return ext switch
    {
        // Textures: Platform compression (ASTC/ETC2) + LZMA is very effective
        ".png" or ".jpg" or ".jpeg" or ".tga" or ".psd" => 0.15f,

        // Audio: Often already compressed or platform optimized
        ".wav" or ".mp3" or ".ogg" => 0.5f,

        // Prefabs/ScriptableObjects: LZMA compression
        ".prefab" or ".asset" => 0.4f,

        // Materials/Shaders: Moderate
        ".mat" or ".shader" => 0.5f,

        // Mesh/Models: Depends on complexity
        ".fbx" or ".obj" => 0.6f,

        // Default: Conservative estimate
        _ => 0.5f
    };
}
| Asset Type | Source Size | Compression Ratio | Estimated Bundle Size |
|---|---|---|---|
| PNG Texture | 3 MB | 0.15x | 450 KB |
| Prefab | 100 KB | 0.4x | 40 KB |
| Audio (WAV) | 5 MB | 0.5x | 2.5 MB |
While not 100% accurate, these estimates provide a reasonable expectation without needing a full build report.
Cross-checking with the Build Report
Since estimates can be uncertain, I made it show actual values when a build report is available:
1
2
3
4
5
6
7
8
9
10
11
12
13
14
15
16
17
18
19
20
21
22
23
24
public static (long totalWaste, int duplicateCount)? GetDuplicationFromBuildReport()
{
    string reportsFolder = "Library/com.unity.addressables/BuildReports";
    if (!Directory.Exists(reportsFolder)) return null;

    var files = Directory.GetFiles(reportsFolder, "buildlayout_*.json")
        .OrderByDescending(f => File.GetLastWriteTime(f))
        .ToArray();

    if (files.Length == 0) return null;

    var report = BuildLayoutReport.Parse(File.ReadAllText(files[0]));

    long totalWaste = 0;
    foreach (var dup in report.DuplicatedAssets)
    {
        if (dup.BundleCount <= 1) continue;
        var asset = report.AllAssets.FirstOrDefault(a => a.Guid == dup.AssetGuid);
        if (asset != null)
            totalWaste += asset.TotalSize * (dup.BundleCount - 1);
    }

    return (totalWaste, report.DuplicatedAssets.Count);
}
A 2-tier display system:
- Estimated Size (Always displayed) - Based on compression ratios.
- Build Report Actual Size (Displayed only after build) - 100% accurate.
Analyzer Bug Fix Results
| Metric | Before Fix | After Fix |
|---|---|---|
| Reported Duplication Size | 38 GB | Hundreds of MBs |
| Accuracy (vs. Build Report) | Over 10x overestimation | Similar to actual values |
| Calculation Basis | Asset Count (ReferenceCount) | Bundle Count (BundleCount) |
Achievements in Resolving Actual Duplications
After fixing the analyzer bug, I removed actual duplicate assets based on accurate data. The results:
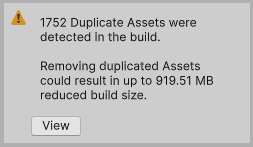 Intermediate progress: reduced from 2,226 to 1,752 duplicates, eventually reaching 0.
| Metric | Before | After | Improvement |
|---|---|---|---|
| Duplicate Assets | 2,226 | 0 | 100% Resolved |
| Total Addressables Size | ~2.4 GB | ~900 MB | 1.5 GB Saved (62%) |
| Waste from Duplication | 919.51 MB | 0 MB | 919 MB Saved |
| StageData Total Size | ~500 MB | ~200 MB | 60% Reduction |
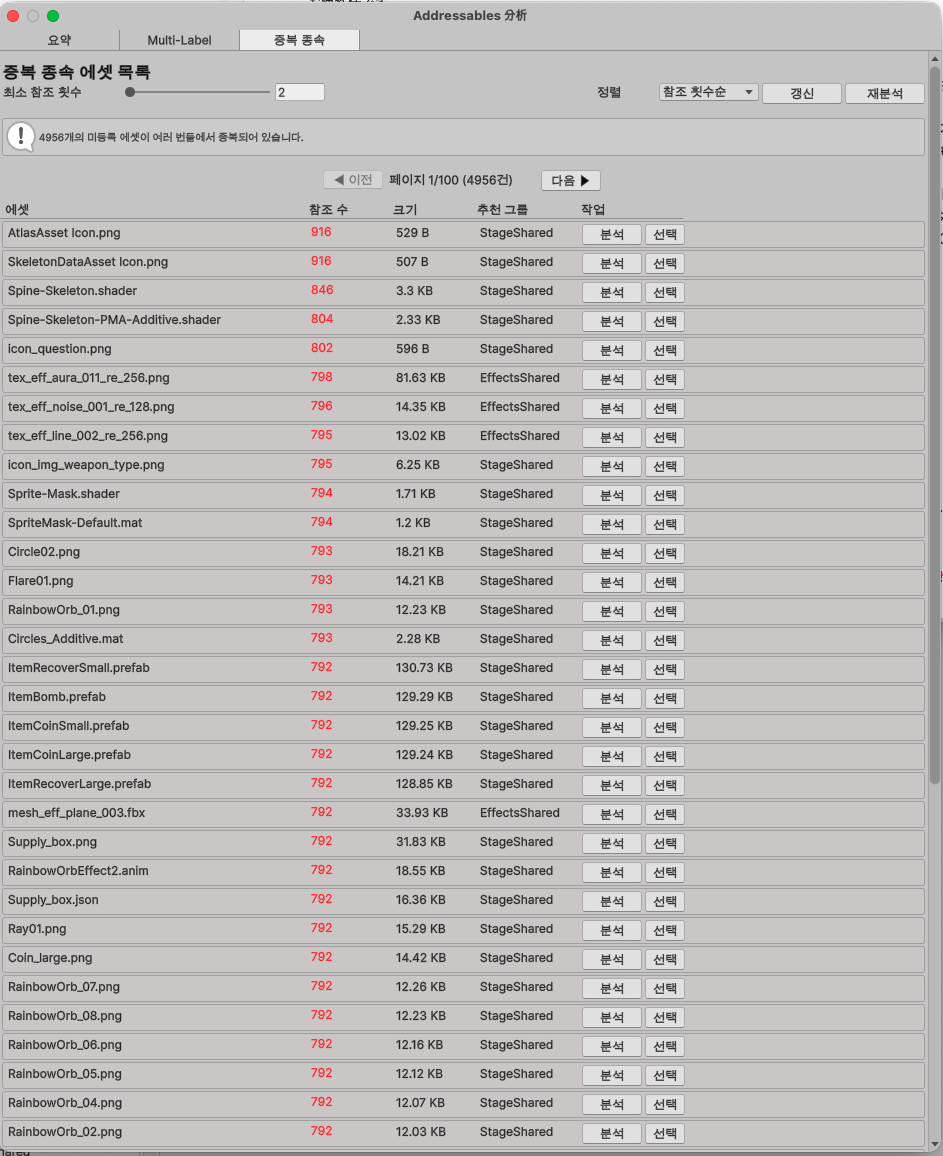
List of duplicate dependencies analyzed by the tool’s Analyzer feature. Shows BundleCount and suggested groups per file.
 Custom Analyzer Popup: Check duplicate assets, bundle counts, and suggested groups at a glance.
Fixing iOS Crashes (Bonus)
During build size optimization, I discovered another serious issue. Crashes were occurring on iOS if ReleaseAssets() was called while a TilemapRenderer was still referencing an Addressable asset during stage transitions.
The fix was simple, but finding the cause was the hard part:
1
2
3
4
5
6
7
8
9
10
11
public void OnExitStage()
{
    // 1. Deactivate renderers first (cut memory references)
    DisableTilemapRenderers();

    // 2. Wait for scene cleanup
    await UniTask.Yield();

    // 3. Safely release assets
    ReleaseAssets();
}
| Metric | Before | After |
|---|---|---|
| Transition Crashes | Frequent | 0 |
| iPhone 8 Plus (3GB) 12x Test | Crashed | Normal Operation |
IV. Core Feature Details
Background Analysis (Preventing UI Freezing)
Analyzing dependencies for thousands of assets would cause the editor to hang. The solution was frame-based chunk processing:
1
2
3
4
5
6
7
8
9
10
11
12
13
14
15
16
17
18
19
20
21
22
23
24
25
26
27
28
29
30
31
private const int EntriesPerFrame = 5;

private void ProcessBackgroundAnalysisChunk()
{
    if (backgroundState.IsCancelled)
    {
        FinishBackgroundAnalysis(false);
        return;
    }

    // Process 5 per frame
    int processed = 0;
    while (processed < EntriesPerFrame &&
           backgroundState.ProcessedEntries < entriesToAnalyze.Count)
    {
        var (group, entry) = entriesToAnalyze[backgroundState.ProcessedEntries];
        ProcessSingleEntry(group, entry);
        backgroundState.ProcessedEntries++;
        processed++;
    }

    // Progress callback
    backgroundState.OnProgress?.Invoke(backgroundState.Progress, backgroundState.CurrentAsset);

    // Completion check
    if (backgroundState.ProcessedEntries >= entriesToAnalyze.Count)
    {
        FinalizeImplicitDependencies();
        FinishBackgroundAnalysis(true);
    }
}
Registered to EditorApplication.update, it processes only 5 assets per frame. Users can see a real-time progress bar and the name of the asset currently being analyzed.
Git Integration: Auto-loading Only Changed Assets
Scanning all assets every time is inefficient. GitHelper runs git diff to automatically load only recently changed assets:
1
2
3
4
5
6
7
8
9
public static List<string> GetModifiedAssets(bool myChangesOnly)
{
    return modifiedFiles
        .Where(f => IsRegistrableAsset(f))
        .Where(f => IsInAssetPaths(f))
        .Where(f => !ShouldExcludeFromRegistration(f))
        .Distinct()
        .ToList();
}
It even filters whether an asset is registrable, in tracked folders, or a dependency asset.
Tool Demo: Improvement Based on Feedback
I continuously improved the tool by receiving feedback from non-developer team members like planners and designers:
Tool UI Demo - Asset cards, group filtering, and the drag-and-drop registration process.
Reduced Asset Registration Time
| Task | Before (Manual) | After (Tool) | Improvement |
|---|---|---|---|
| Register 1 Asset | 30s-1m | 5s (2 clicks) | 90% faster |
| Register 100 Assets | 50m-100m | 5m | 90-95% faster |
| Find Unregistered Assets | Impossible | 3s (Auto scan) | Infinite |
| Detect Misplaced Groups | Review-dependent | 0 cases (Auto) | 100% |
3-Language Localization (For Collaboration)
This tool is used by Japanese planners and Korean developers. Therefore, I supported three languages: English, Japanese, and Korean.
1
2
3
4
5
6
7
8
public static readonly Dictionary<string, Dictionary<Language, string>> localizations = new()
{
    ["btn_register"] = new() {
        [Language.English]  = "Register",
        [Language.Japanese] = "登録",
        [Language.Korean]   = "등록"
    },
};
Called with a one-line helper:
1
EditorGUILayout.LabelField(AddressablesLocalization.Get("btn_register"));
V. Building Tools with AI Collaboration
Debugging the 38GB Bug with Claude Code
After discovering the 38GB ghost duplication bug, I used Claude Code to diagnose and fix it. The conversation flow was as follows:
Step 1: Raising the Issue
1
2
Me: "The 38GB figure seems abnormal. It's more than 10x the current bundle size."
    (Attached CSV file + screenshots)
Step 2: Claude’s Data Analysis
- Found
tile_base_001.pngwith RefCount=413, Size=1.74MB in the CSV. - Noted that “this one file’s duplication is being calculated as 717MB.”
- Explained bundle generation in “Pack Together By Label” mode.
Step 3: Suggested Solutions Claude proposed three approaches:
- Track BundleCount - Use a
HashSetto calculate actual bundle counts. - Estimate Compression - Apply compression ratios per asset type.
- Integrate Build Report - Cross-check with actual values.
Step 4: Implementation + Verification Resolved by modifying three files—DuplicationAnalyzer.cs, AnalyzerPopup.cs, and AnalysisCache.cs—in a single session with 38 messages.
Pros and Cons of AI in Editor Tool Development
What AI is good at:
- Data analysis (parsing CSVs, detecting outliers).
- Pointing out logical errors in algorithmic logic.
- Maintaining consistency across multiple modified files.
- Generating boilerplate code (IMGUI layouts, etc.).
What is difficult for AI:
- Predicting the visual output of IMGUI (must be checked manually).
- Understanding the real-time state of the Unity Editor (e.g., current Addressable settings).
- Handling edge cases in interaction logic like Drag and Drop.
In conclusion, a division of labor where AI handles logic/analysis while humans verify UI/UX was highly effective.
VI. Retrospective
Overall Results
| Category | Metric | Figure |
|---|---|---|
| Build Optimization | Total Addressables Size | 2.4GB → 900MB (62% reduction) |
| Duplicate Assets | 2,226 → 0 (100% resolved) | |
| Duplication Waste | 919MB → 0MB | |
| Stability | iOS Crashes | Frequent → 0 |
| Productivity | Register 100 Assets | 100m → 5m (95% faster) |
| Search Unregistered | Impossible → 3s | |
| Detect Misplaced Groups | Frequent → Automatic | |
| Development | Period | Approx. 2 weeks (AI collab) |
| Lines of Code | 3,000+ | |
| Supported Asset Types | 15+ | |
| Supported Languages | 3 (EN/JP/KO) |
Lessons Learned
1. “Asset Count” and “Bundle Count” are different Confusing these in Addressables’ “Pack Together By Label” mode leads to massive overestimation. This is a practical trap rarely mentioned in documentation.
2. Estimates always need cross-checking Compression estimates alone aren’t enough. Always provide a path to compare with actual build reports.
3. Scalable design saves time in the long run Strategy Pattern + Auto-Discovery reduced the cost of adding a new asset type to “just creating a class.” While the initial interface design took time, the investment paid off through six subsequent detector additions.
4. Codifying rules eliminates human error Mistakes like directly referencing Naninovel BGMs are hard to catch in manual reviews. Codifying rules so the tool detects them automatically at registration ensures mistakes are not repeated.
5. AI tools are strong at “providing direction” For the 38GB bug, providing the data allowed Claude to immediately pinpoint the difference between BundleCount and ReferenceCount. This was much faster than a human reading a CSV line by line to find patterns. Completing a 3,000+ line production editor tool in just 2 weeks was only possible through AI collaboration.